Feel free to leave your vote:
13
Share template with others
Summary
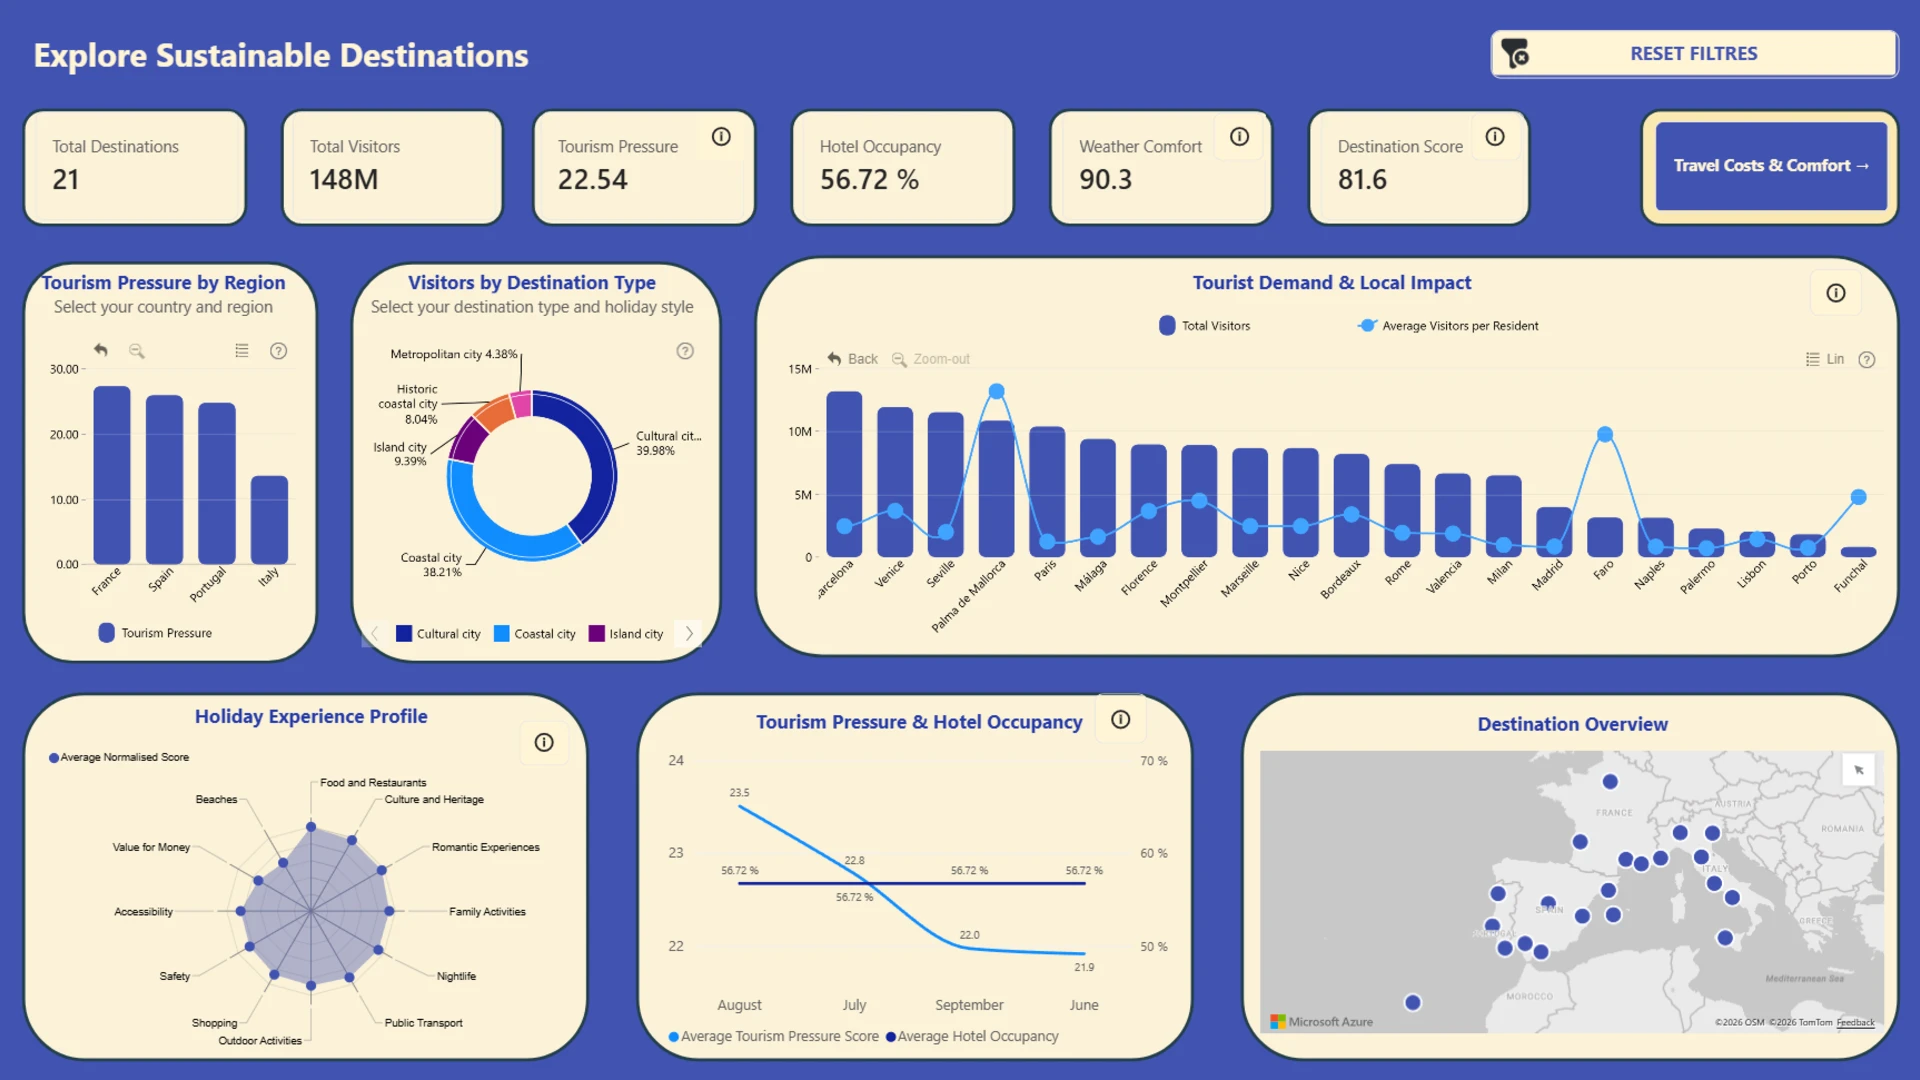
This interactive Power BI report explores European summer travel destinations, with a focus on travel costs, tourism pressure, visitor impact, accommodation, flight options, weather, and holiday experience. Users can compare destinations, explore seasonal patterns, break down travel costs, and find options that best match their travel preferences.
This interactive Power BI report was prepared for the FP20 Analytics Challenge in September 2026.


Mobile view allows you to interact with the report. To Download the template please switch to desktop view.
