Feel free to leave your vote:
0
Share template with others
Summary
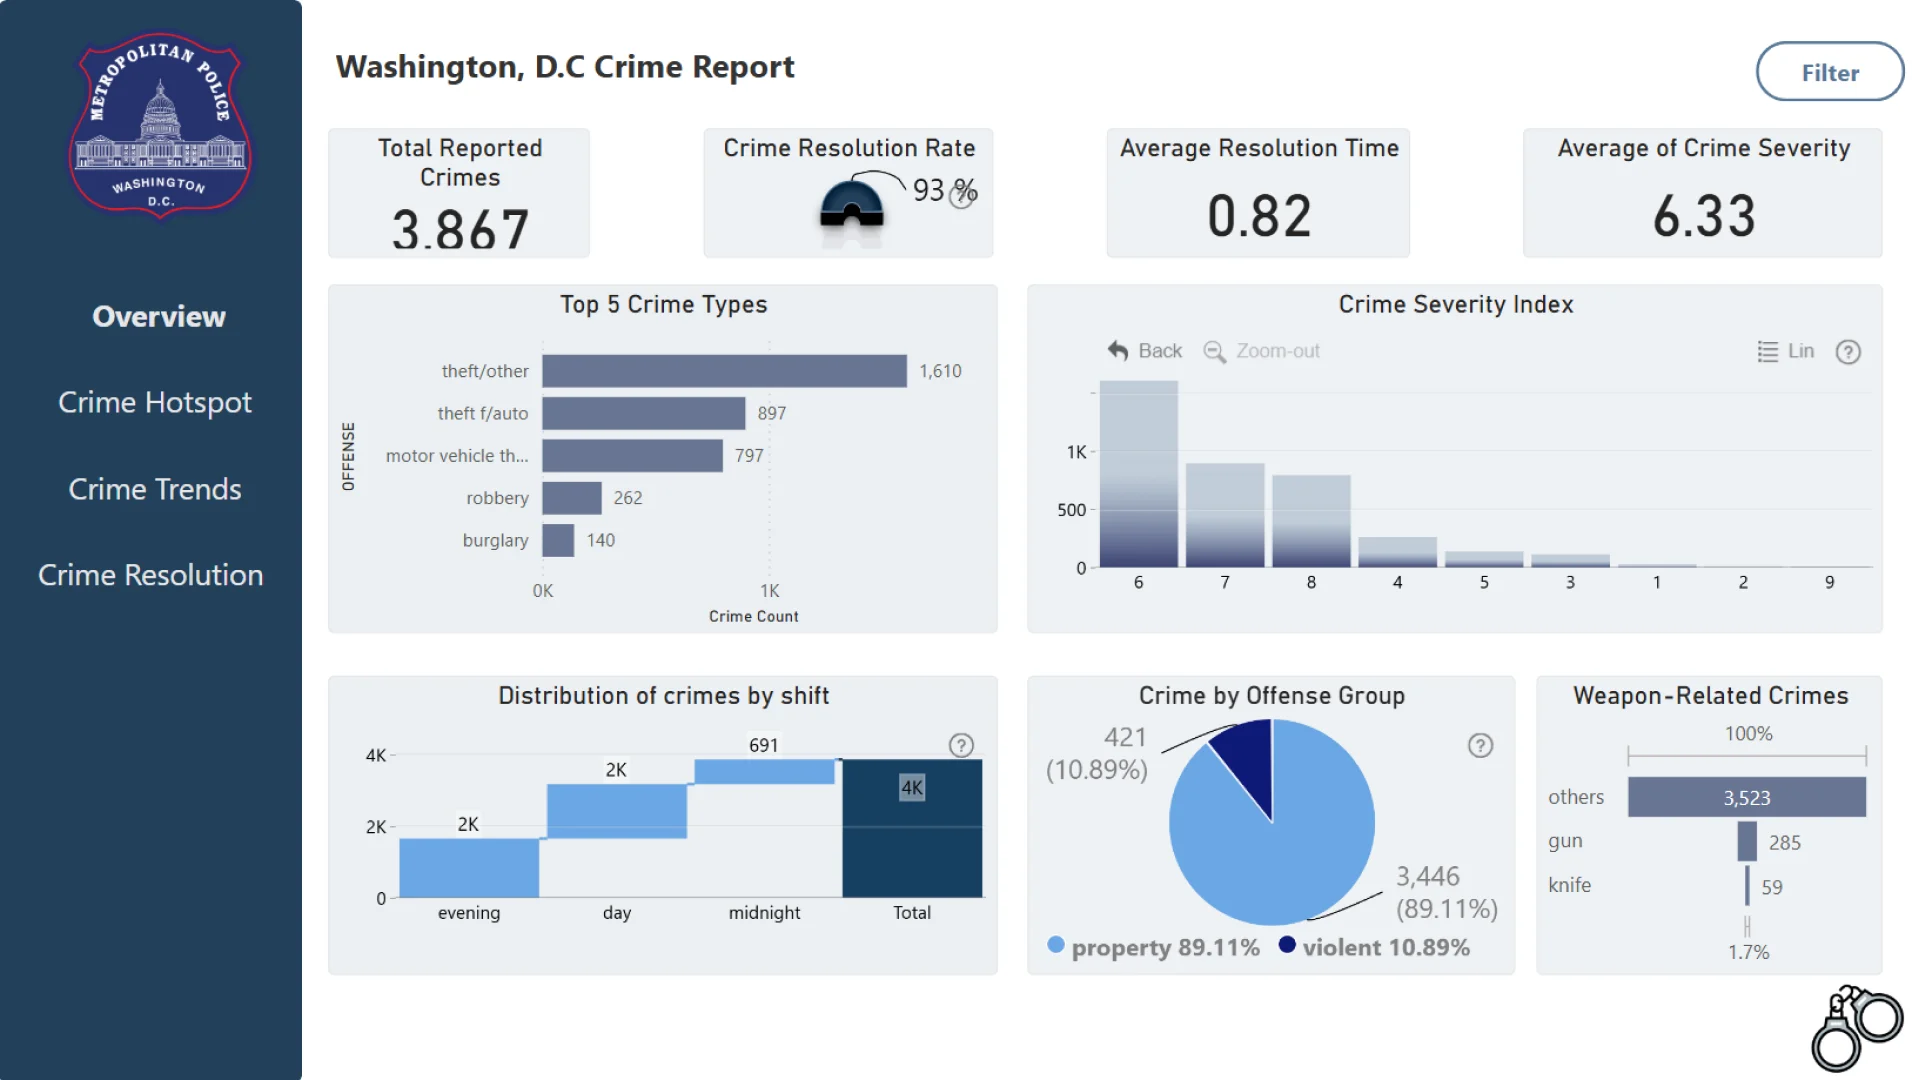
Report submitted for Onyx Data DataDNA ZoomCharts Mini Challenge, March 2025. The report is based on the Crime Analysis Dataset and includes ZoomCharts custom Drill Down PRO visuals for Power BI.
Author's Description
This comprehensive report analyzes January 2025 crime patterns across the district, revealing key operational insights. With 3,867 total incidents, the data shows a 93% resolution rate achieved in under 24 hours on average. Property crimes, particularly theft (1,610 cases), dominate at 89% of all offenses, while evening shifts experience peak criminal activity (1,663 incidents). Geographic analysis identifies Cluster 2 as the highest-crime neighborhood (290 incidents), with 14th Street NW being the most problematic block (63 cases). The report highlights District 2's exceptional performance, resolving 95% of property crimes. These findings enable targeted resource allocation, with clear priorities emerging: enhanced evening patrols, focused interventions in high-density areas, and replication of best practices from top-performing districts to improve citywide public safety outcomes.
ZoomCharts visuals used
Mobile view allows you to interact with the report. To Download the template please switch to desktop view.
