Feel free to leave your vote:
8
Share template with others
Summary
Report submitted for FP20 Analytics ZoomCharts Challenge 14 (March 2024). The report was built with the National Fuel Market Analysis dataset and includes ZoomCharts custom Drill Down PRO visuals for Power BI.
Author's description:
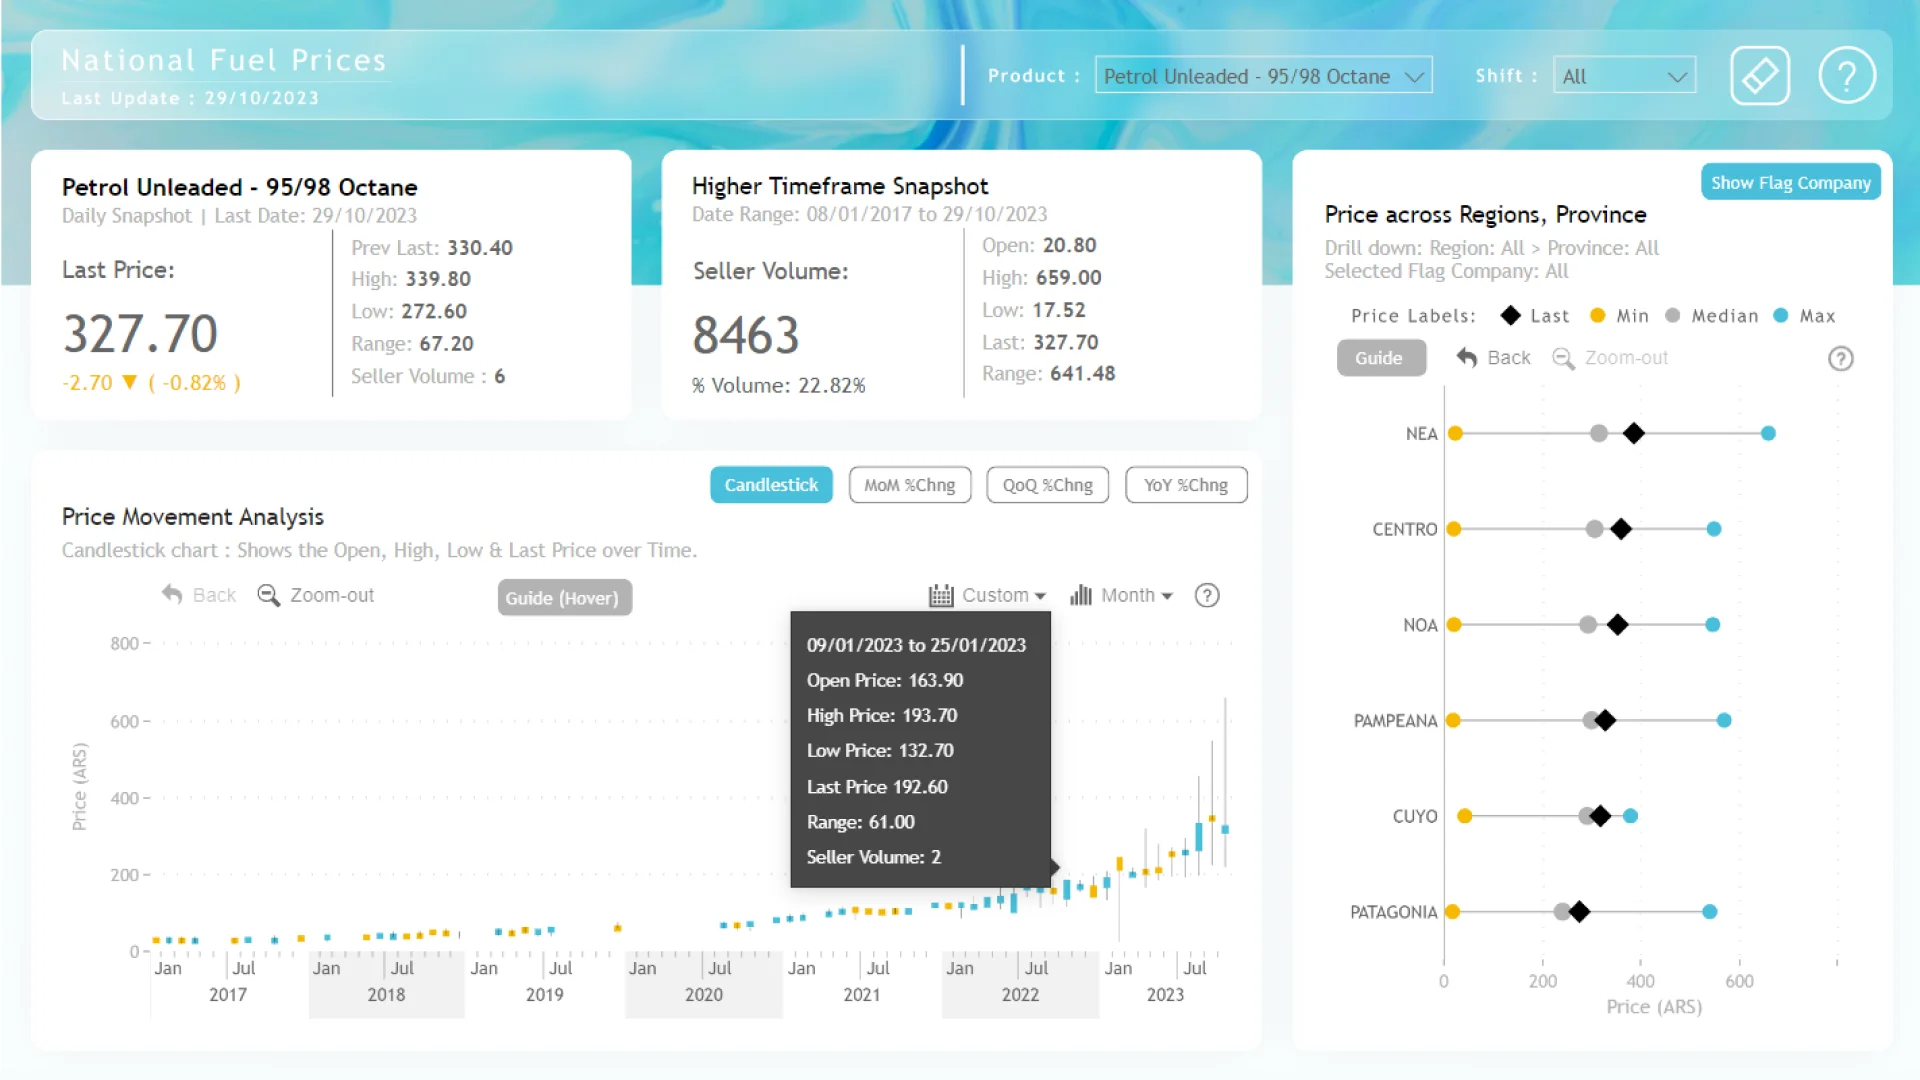
Dashboard Features:
📊 Recent Price Snapshot: Quickly assess the latest fuel prices including last price, daily high and low, volatility, and seller volume.
📈 Higher Timeframe Overview: Gain insights into fuel price trends over a selected timeframe.
📊 Candlestick Chart: Visualizing fuel price movements over time.
📉 Price Change Analysis: Tracking MoM, QoQ, and YoY percentage changes.
🗺️ Regional and Provincial Price Comparison: Examining variations across regions and provinces.
🏴 Flag Companies Price Analysis: Understanding dynamics among flagged companies.
Mobile view allows you to interact with the report. To Download the template please switch to desktop view.