Feel free to leave your vote:
0
Share template with others
Summary
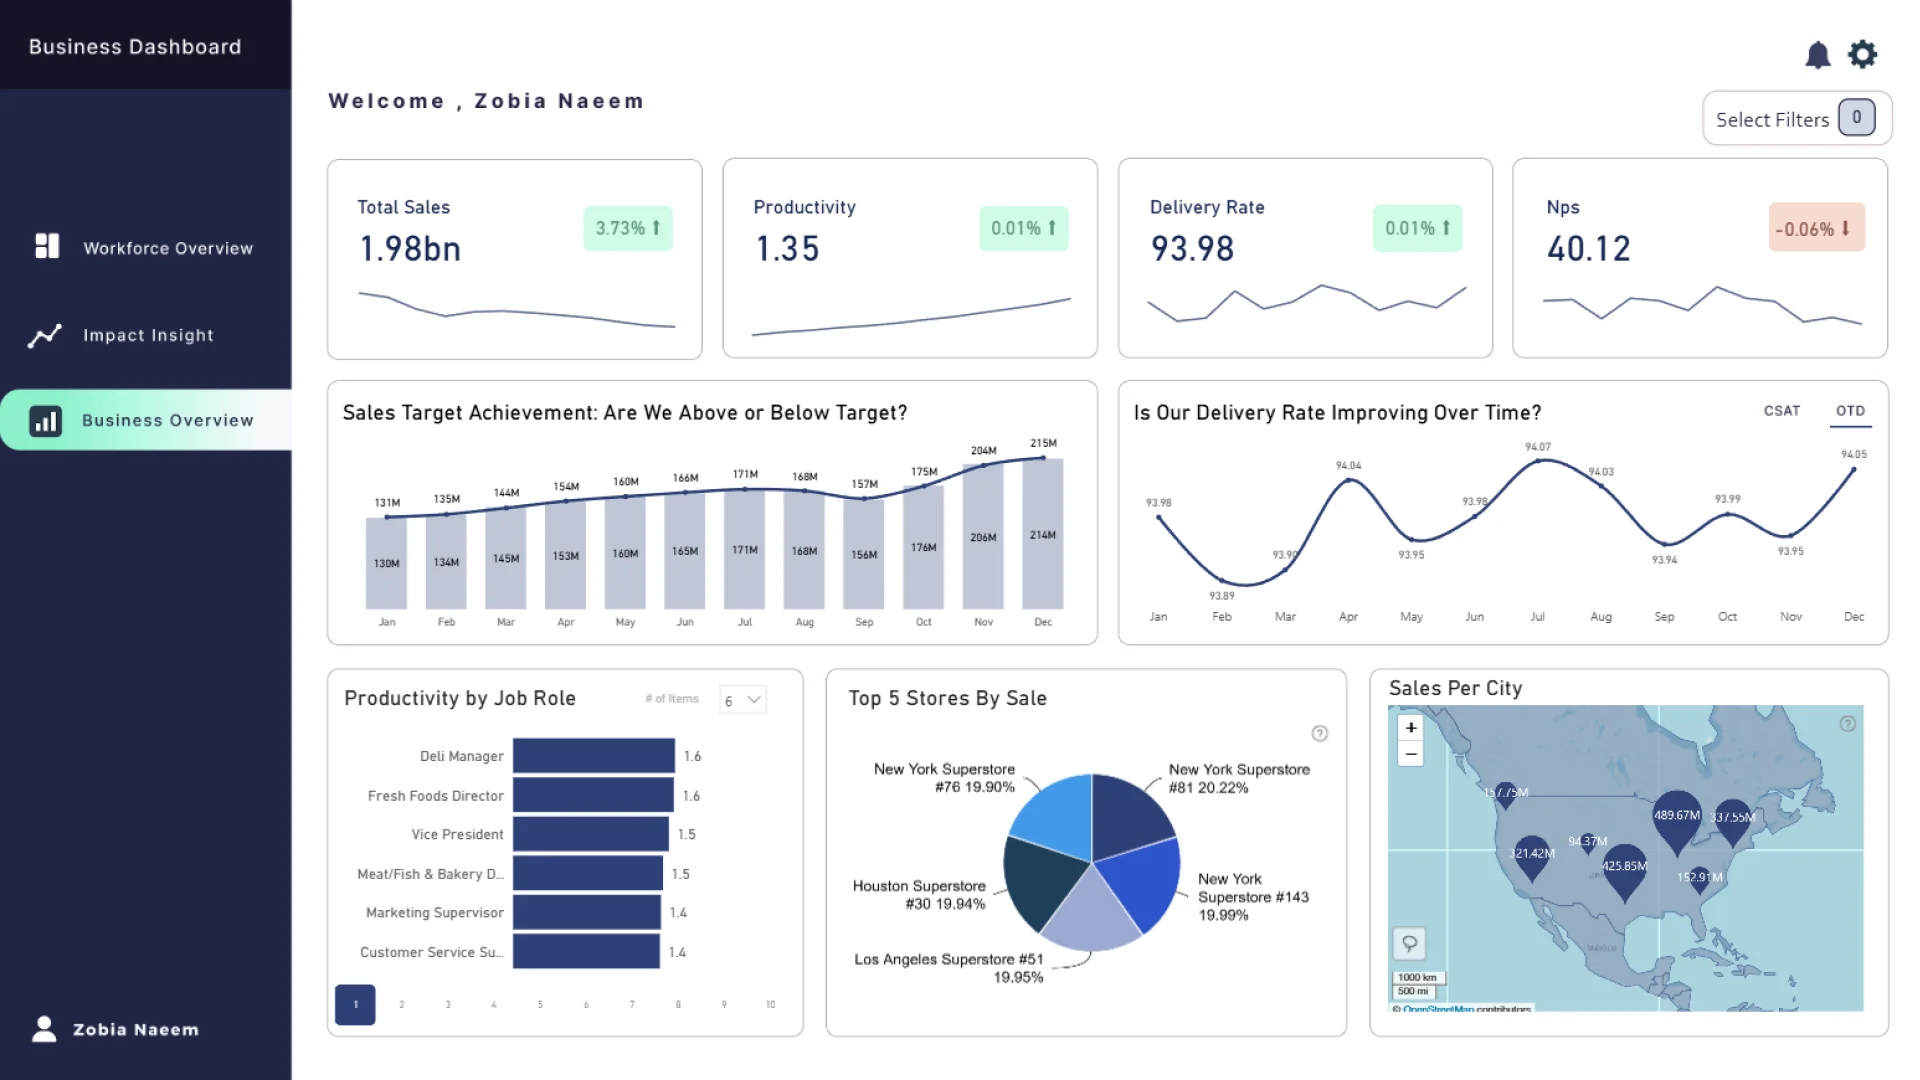
This Power BI report uses the Employee Performance HR dataset and features ZoomCharts Drill Down PRO custom visuals for Power BI. It was submitted to the FP20 Analytics ZoomCharts Data Challenge 30 in September 2025.
Author's Description:
This business dashboard provides a comprehensive view of organizational performance by combining sales, workforce, and employee insights. It highlights key metrics such as total sales, productivity, delivery rate, NPS, headcount, employee exits, and salary distribution, while also tracking trends over time. The dashboards further break down performance by department, job role, and geography, offering clarity on sales per city, productivity by role, and average salaries. Employee-focused insights include satisfaction scores, manager impact on performance, and promotion readiness, ensuring leadership can evaluate both business outcomes and workforce health. Overall, it serves as a strategic tool to monitor financial growth, operational efficiency, and employee engagement in one unified view.
Mobile view allows you to interact with the report. To Download the template please switch to desktop view.