Feel free to leave your vote:
7
Share template with others
Summary
This two-page Power BI dashboard explores how travel timing and destination choice affect the cost and experience of a Mediterranean summer holiday.
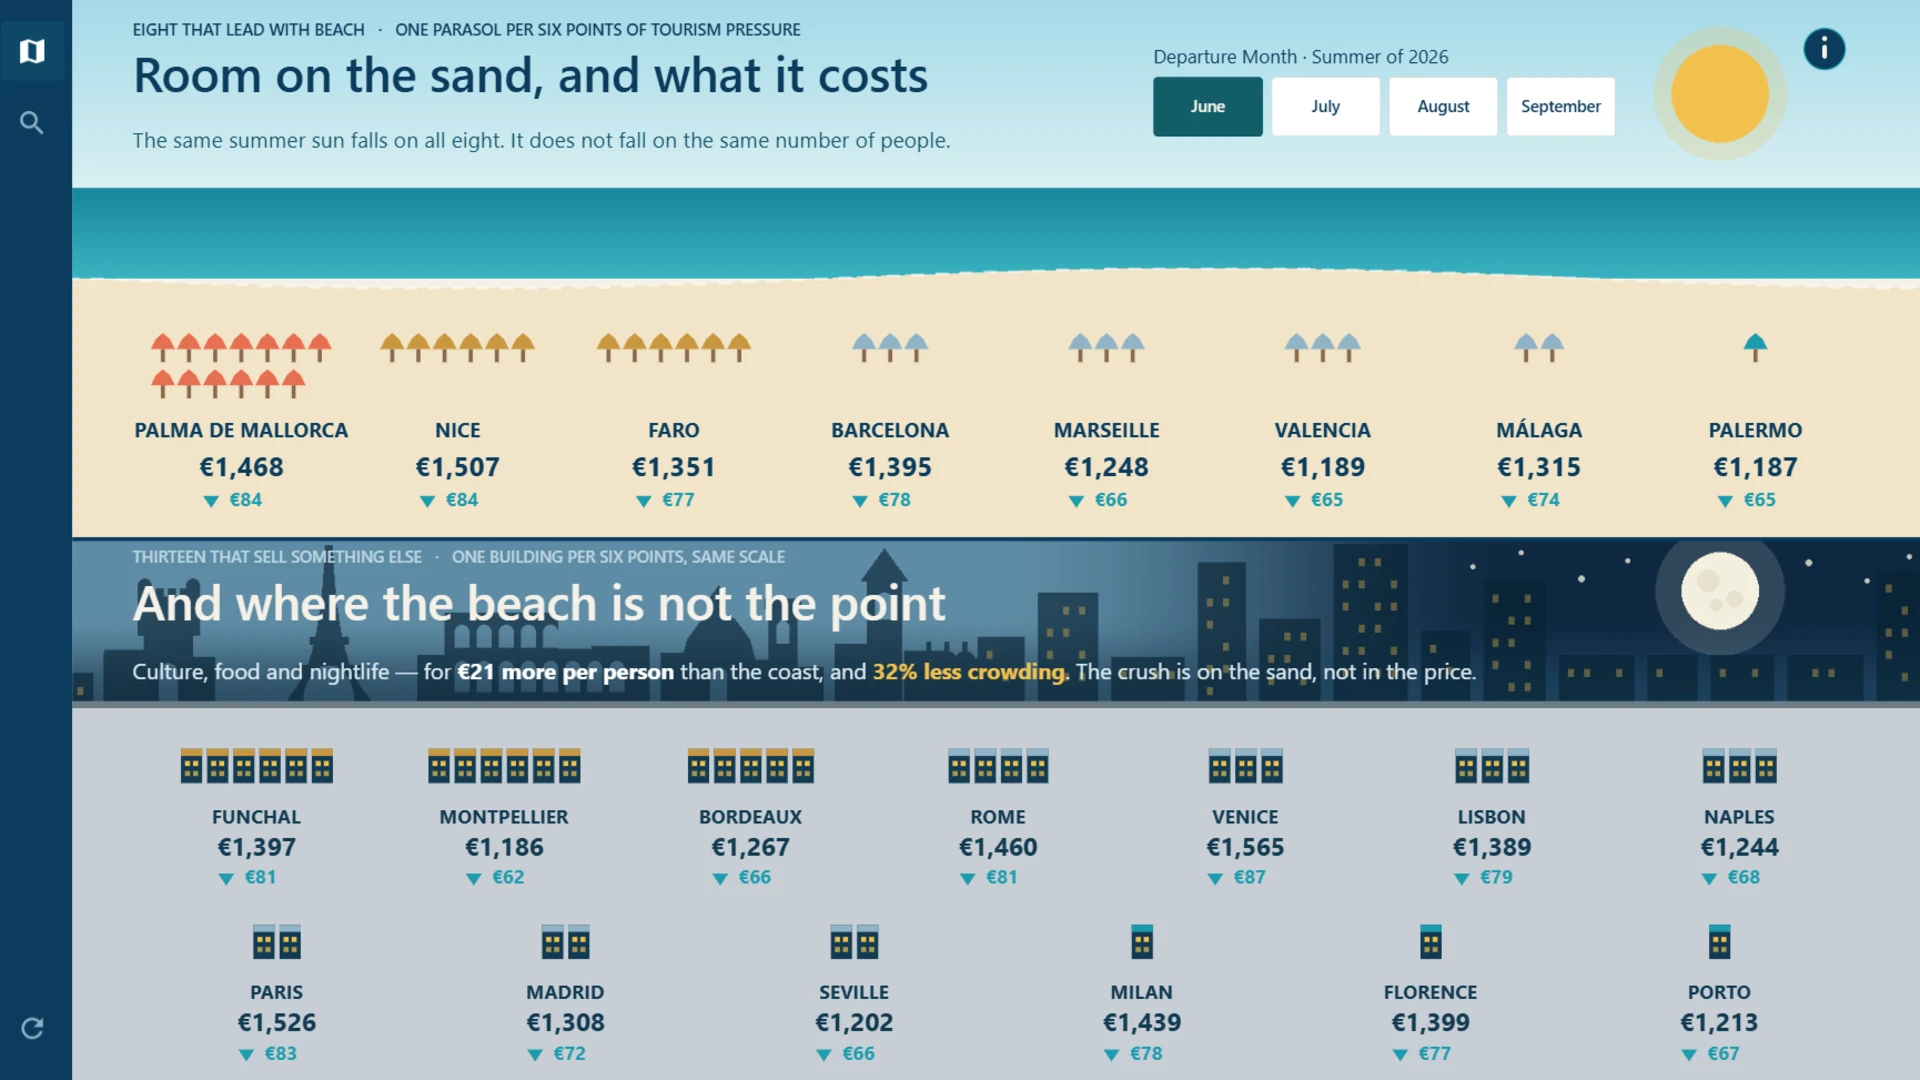
The analysis shows that when you travel can have a bigger impact than where you go. September averages €1,271 per person compared with €1,550 in August, while also having significantly fewer days of extreme heat across the same 21 destinations.
The Summer Travel page compares eight beach-focused destinations with thirteen destinations known for culture, food, and nightlife. It looks at travel costs, tourism pressure, weather, and the overall holiday experience.
The Pick Your Spot page helps users compare destinations in more detail using three ZoomCharts Drill Down visuals. The scatter chart compares price and quality, the Facet Chart explores traveller profile, country, city, and flight costs, while the Map shows where extreme heat is most common.
The report also explains how to read the visuals and clearly states the main data assumptions. Tourism pressure is based on 2024 data, prices are for 2026, and weather figures are historical averages rather than forecasts.


Mobile view allows you to interact with the report. To Download the template please switch to desktop view.
