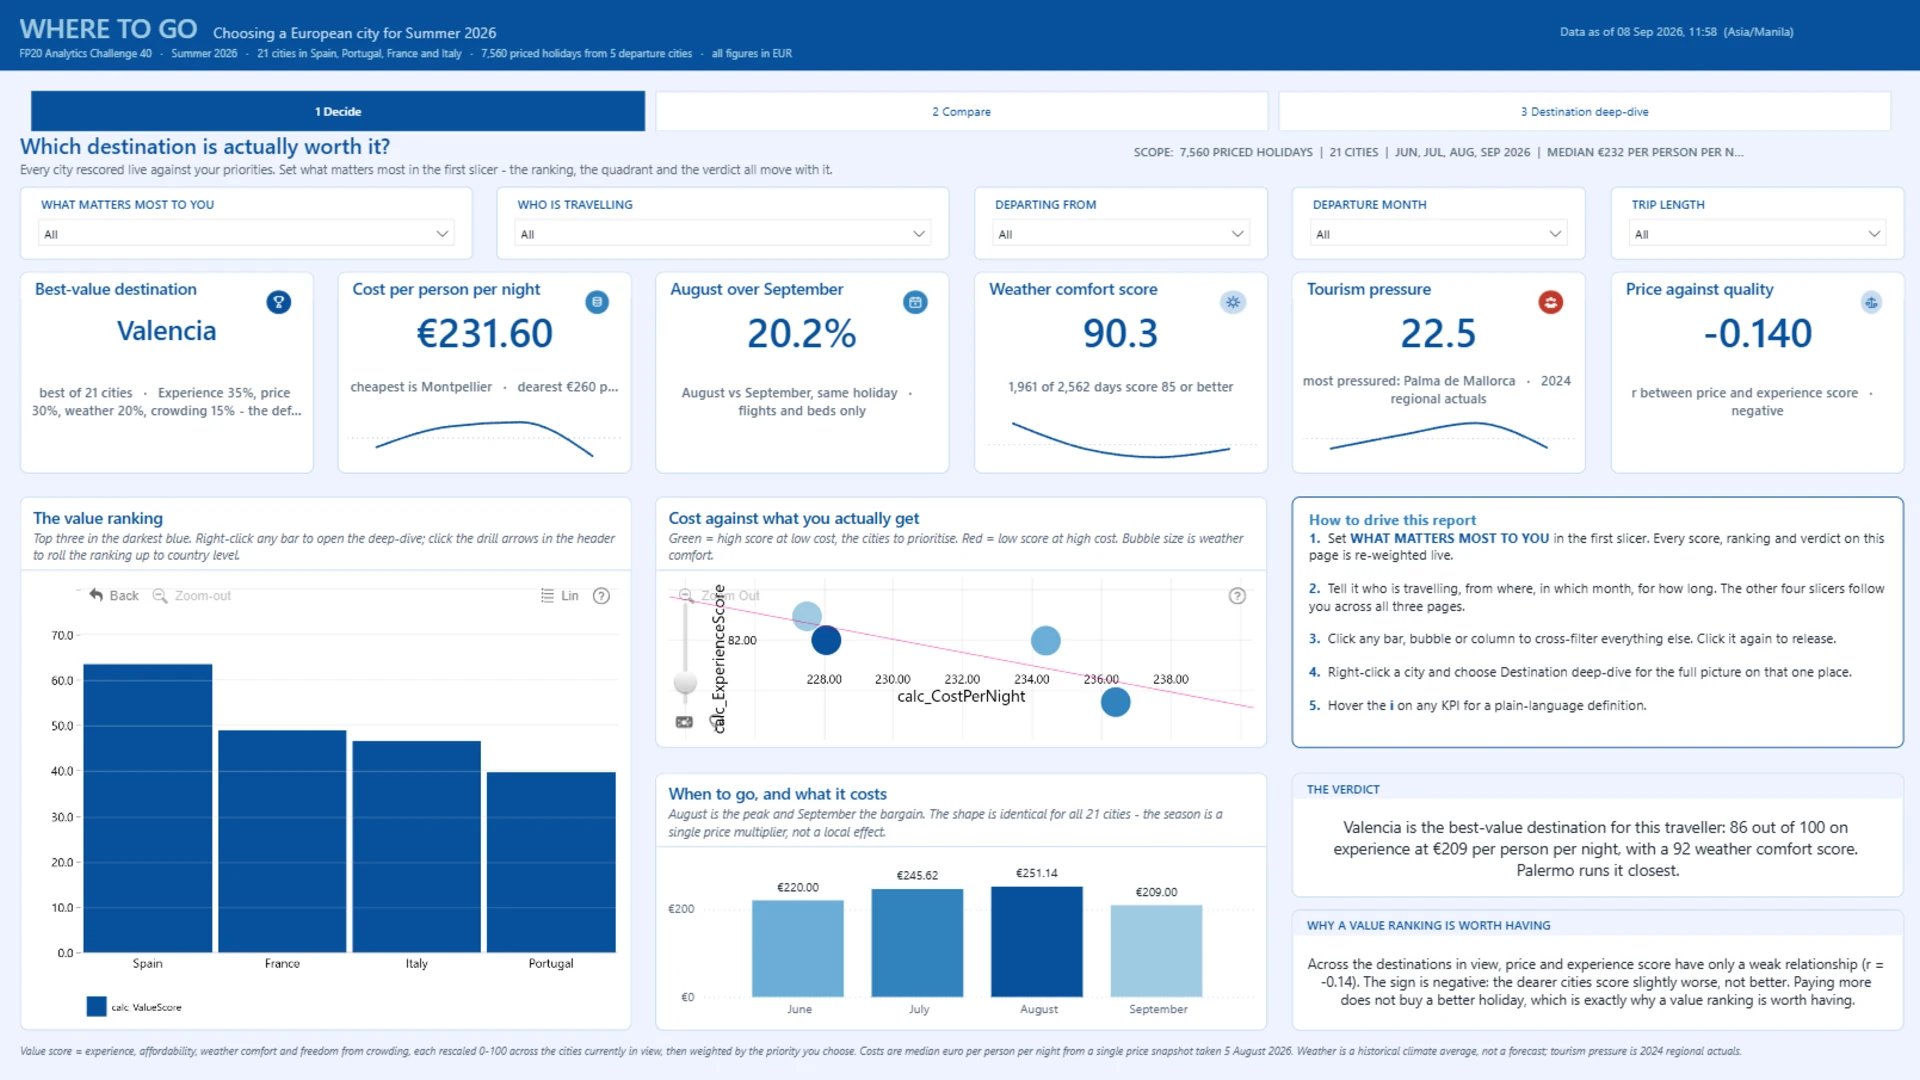
This interactive Power BI dashboard helps answer one question: which European destination is worth it for you?
1. Decide — Choose what matters most and the scores, rankings, and recommendations update accordingly. The value score considers experience, affordability, weather comfort, and tourism pressure, while the cost-versus-value view helps identify destinations that offer more for the money.
2. Compare — Explore the full trip cost, including accommodation, flights, food, transport, attractions, baggage, and tourist tax. Compare destinations and travel months, see how weather conditions change throughout the summer, and explore different measures and cost combinations.
3. Destination Deep-Dive — Right-click any city to explore it in more detail. Compare suitability across 12 categories, review temperatures, check airfare by departure city, and browse available travel options ranked by cost per person per night.
The Power BI dashboard covers 7,560 holiday options across 21 cities in Spain, Portugal, France, and Italy, with five departure cities and travel dates from June to September 2026.
Weather figures are based on historical climate averages rather than forecasts. Tourism pressure and hotel occupancy use 2024 NUTS 2 regional data, so cities within the same region may share these values.
For the best experience, we recommend upgrading to ensure that all website features display correctly.
Cookie settings
We use necessary cookies for site functionality, as well as statistic, marketing, and preference cookies to enhance your experience. For more information and to manage your preferences, please visit our Cookie policy

