Feel free to leave your vote:
0
Share template with others
Summary
This Power BI report uses the Education/Student Performance dataset and features ZoomCharts Drill Down PRO custom visuals for Power BI. It was submitted to the FP20 Analytics ZoomCharts Data Challenge 31 in October 2025.
Author Description:
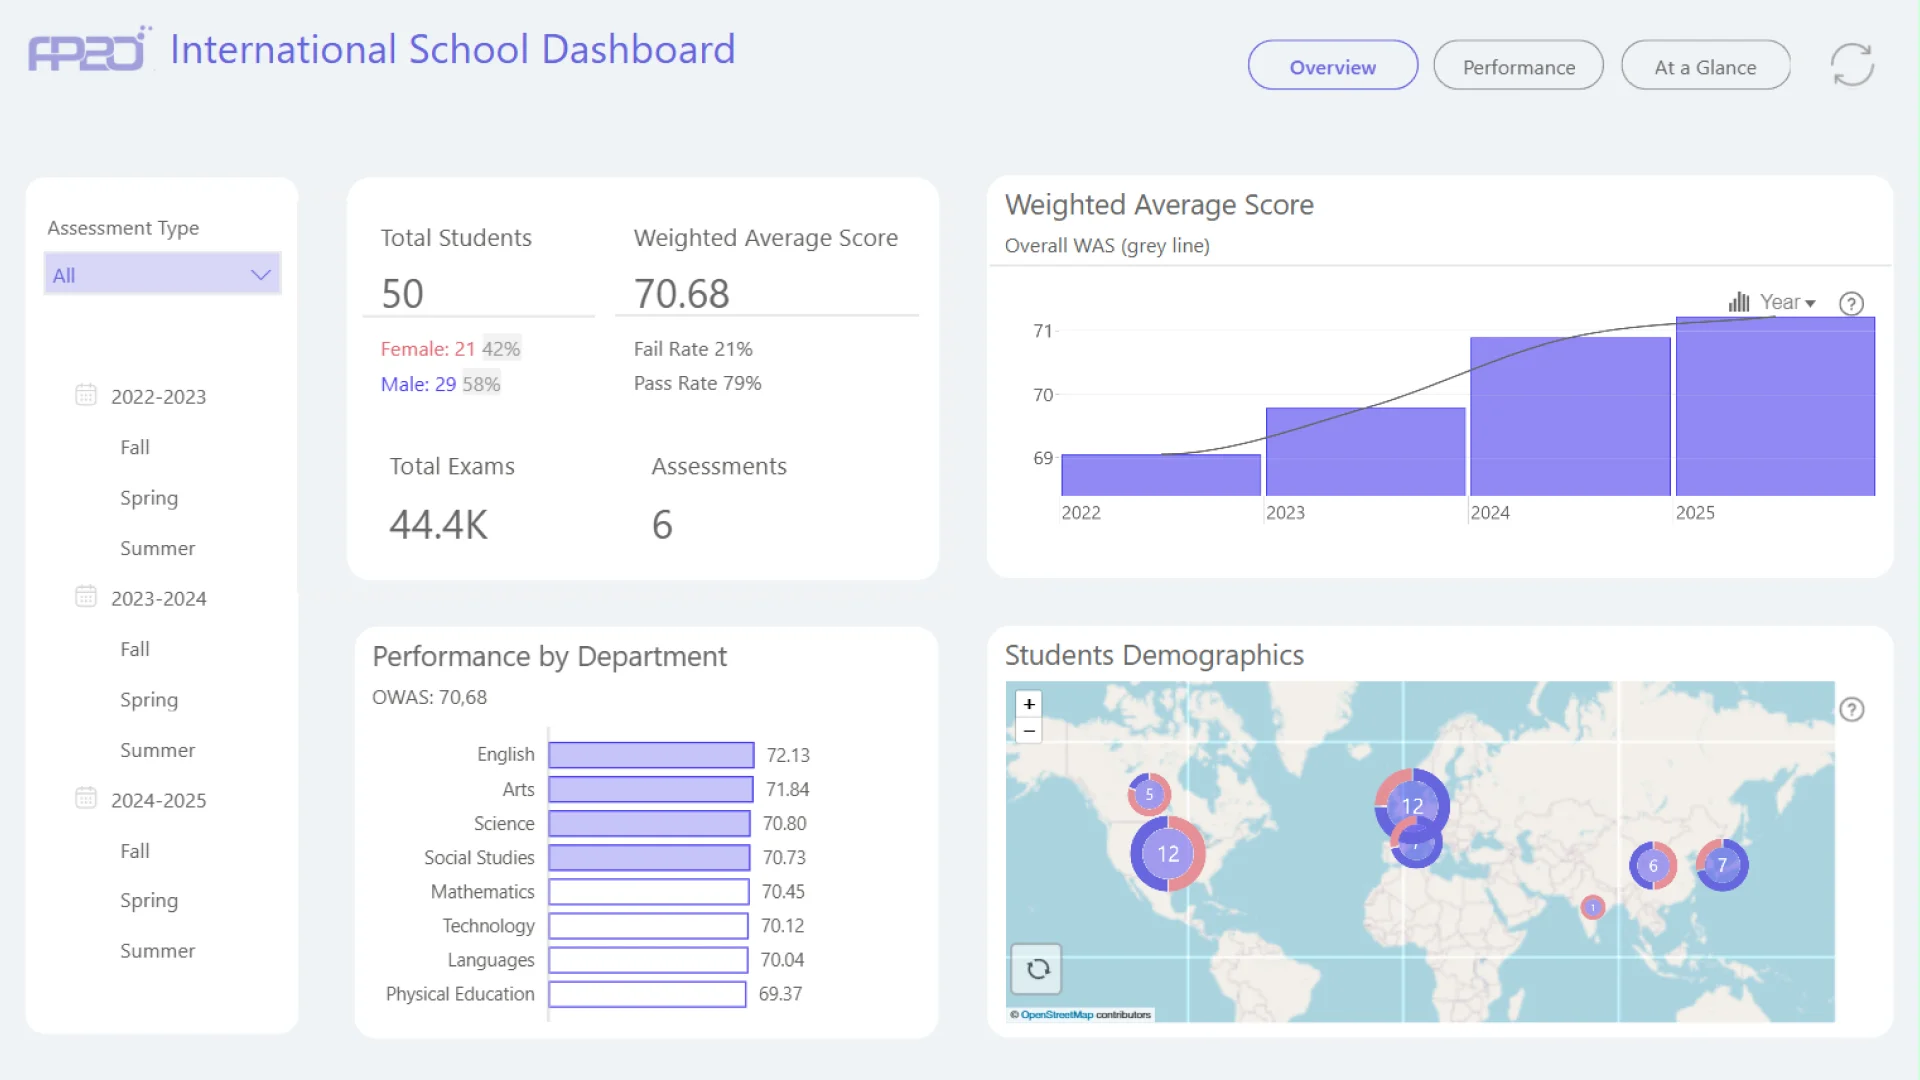
The International School Performance Dashboard is a Power BI solution developed for the FP20 Analytics Challenge 31, analyzing 50 students across 8 departments over 3 academic years. It features key metrics such as a Weighted Average Score of 70.68, a 79% pass rate, and insights from 44,392 assessments. The dashboard includes pages for overall institutional performance, individual student and teacher analysis, and a card-style summary view comparing demographics and performance across cohorts. Built with a star schema model and over 30 DAX measures, it offers dynamic rankings, year-over-year comparisons, and interactive filtering for deeper insights.
Mobile view allows you to interact with the report. To Download the template please switch to desktop view.