Feel free to leave your vote:
3
Share template with others
Summary
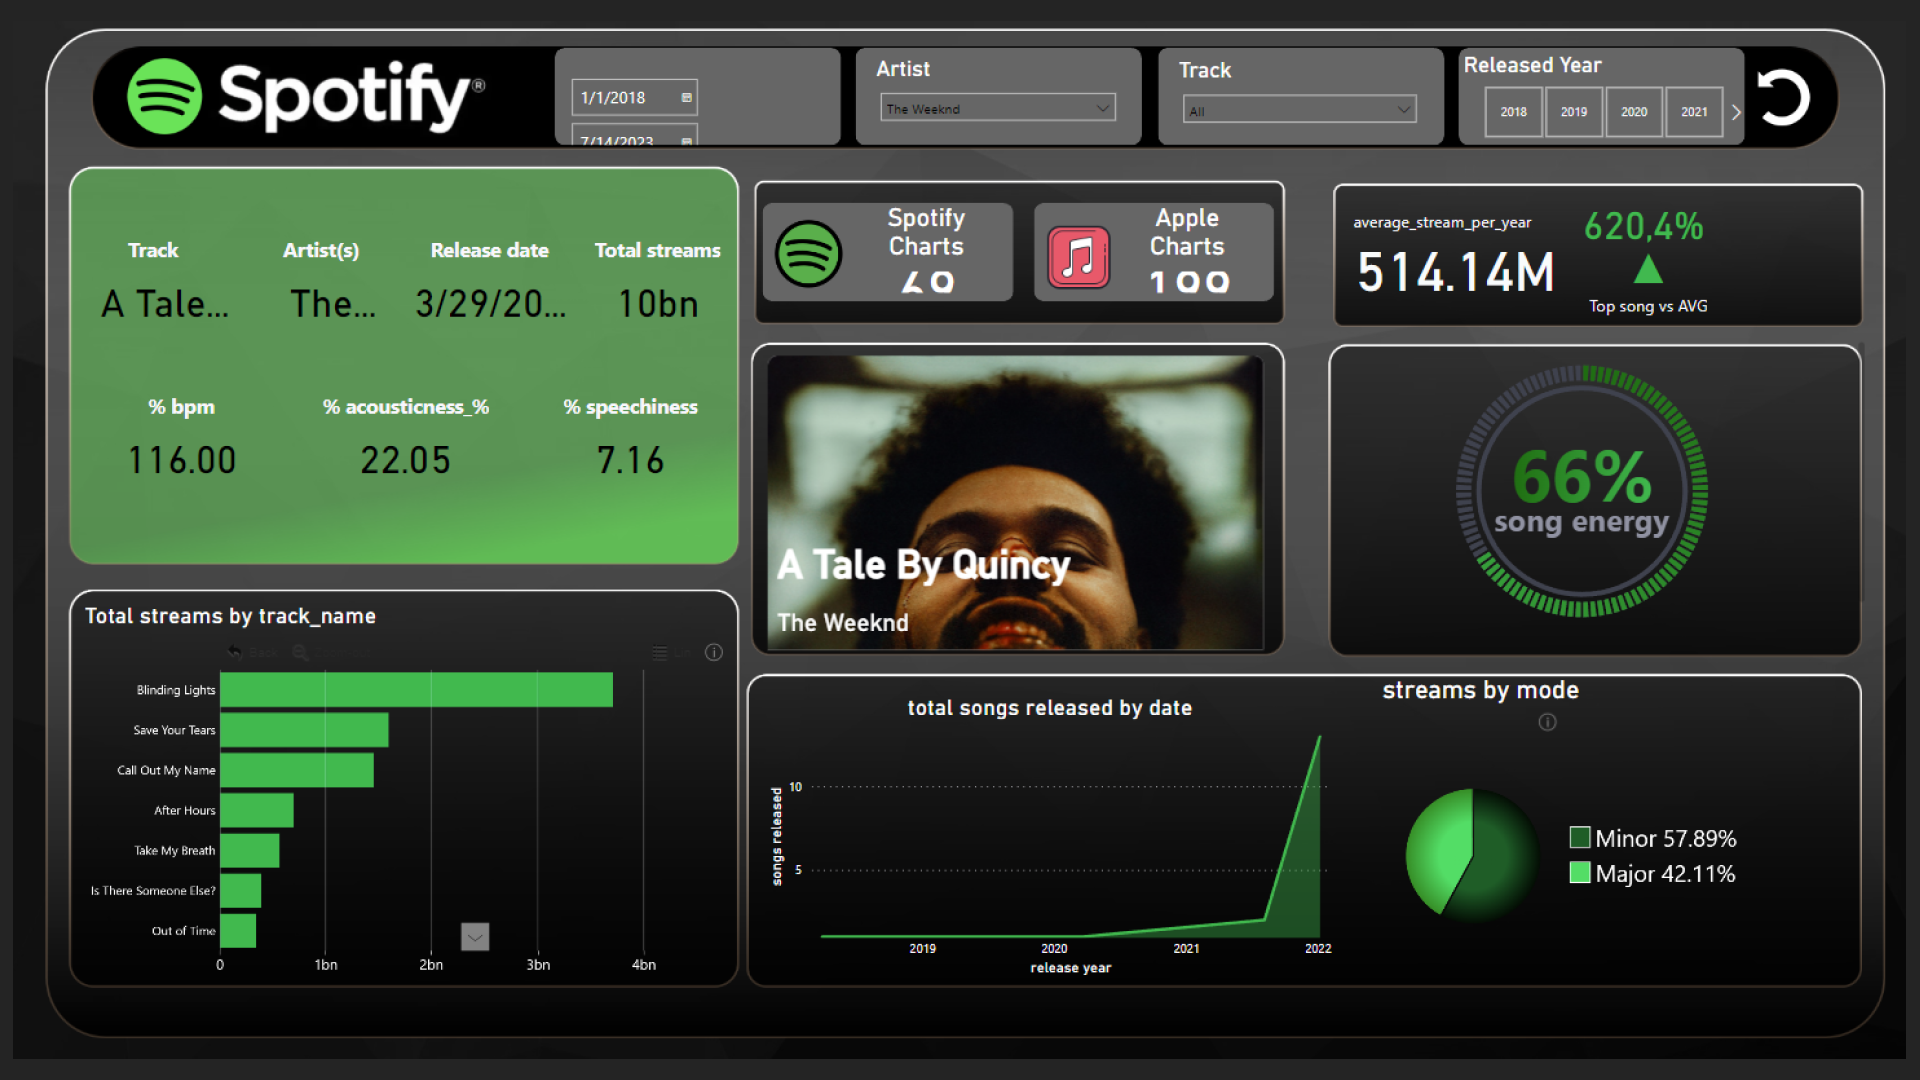
Report submitted for Onyx Data DataDNA ZoomCharts Mini Challenge, October 2023. The report was built based on Spotify dataset and includes ZoomCharts custom Drill Down PRO visuals for Power BI.
Author's description:
The dashboard has various slicers that allow the user explore the song streaming performance by selecting the artists, the tracks, and the date ranges between when the songs were released. I usually engage with friends about who the best artists are, and the next time when I engage in a debate with my friends regarding this, I would easily pull this dashboard to support my arguments
Mobile view allows you to interact with the report. To Download the template please switch to desktop view.
