Feel free to leave your vote:
8
Share template with others
Summary
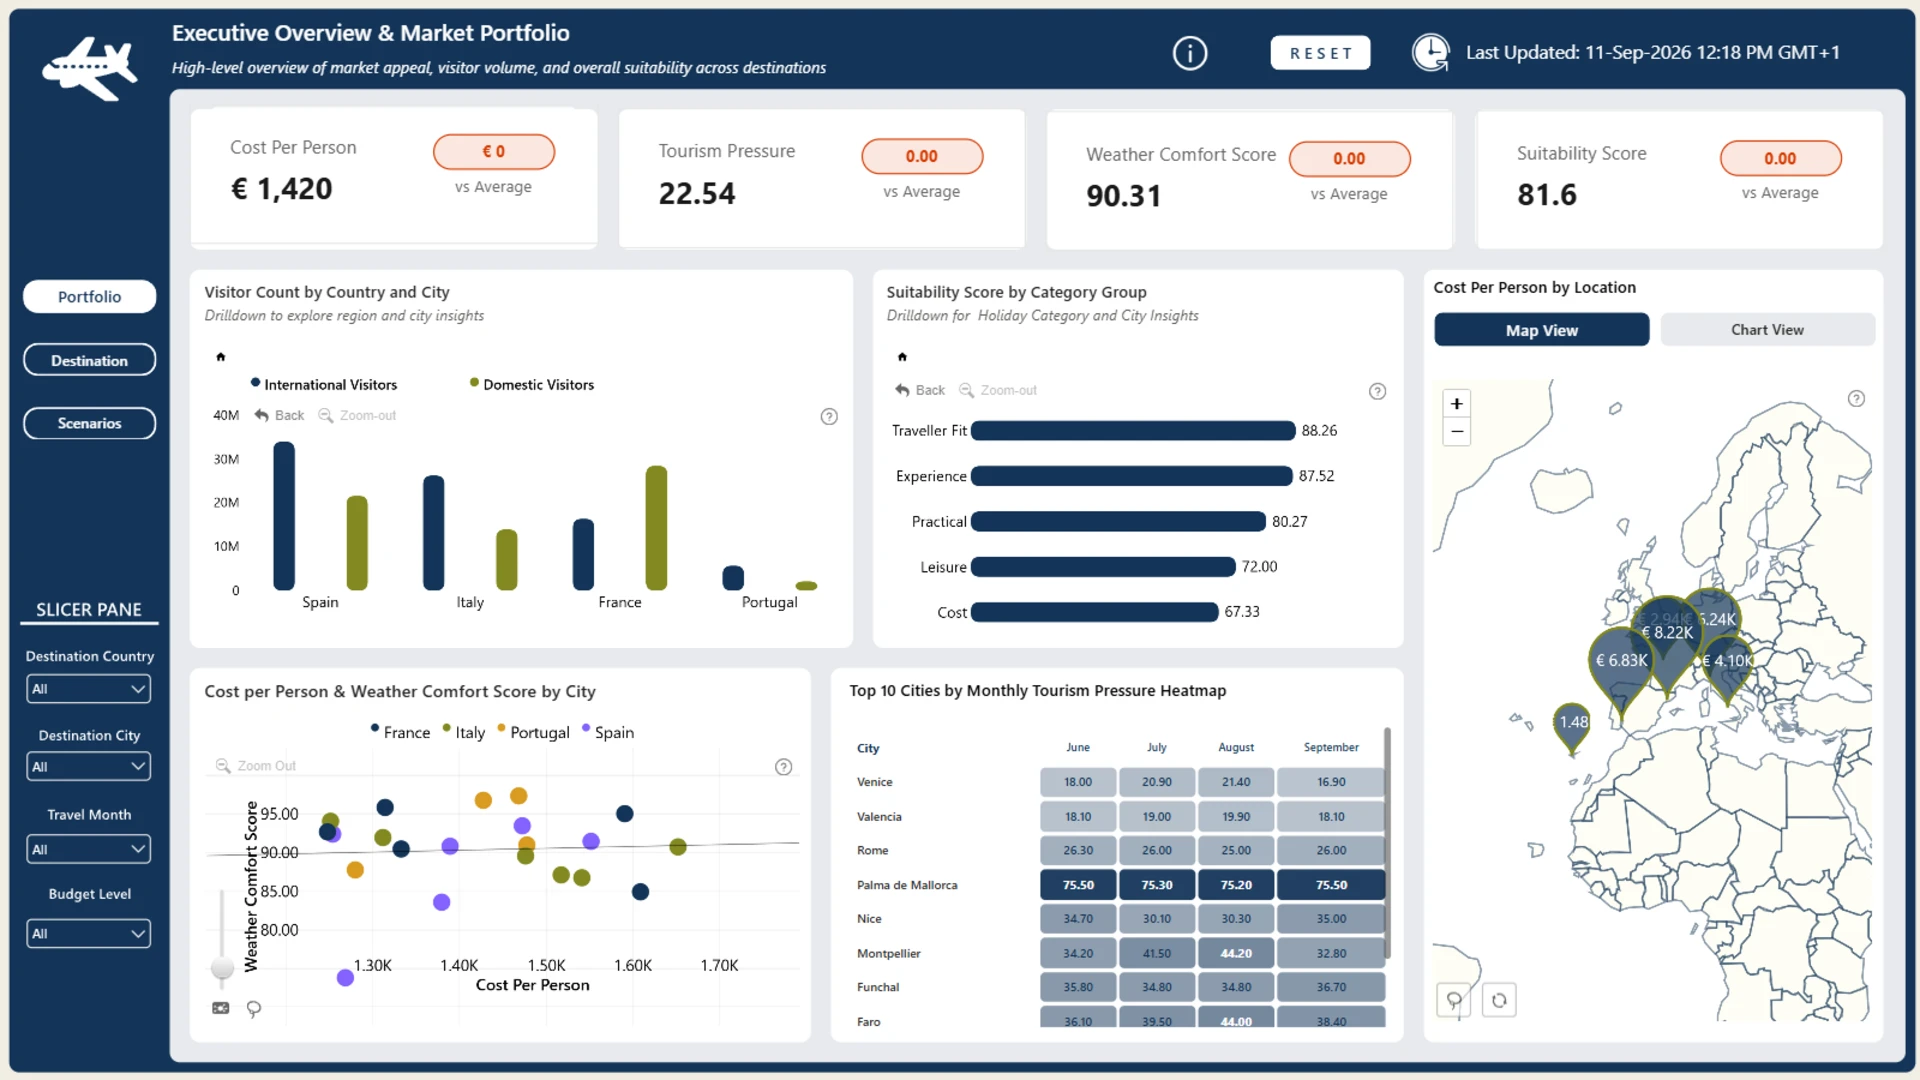
This interactive, three-page Power BI dashboard offers an end-to-end analytical solution for evaluating European travel destinations, route efficiencies, and holiday package costs. It combines high-level executive market overviews with deep-dive climate and cost decompositions, supported by custom SVG visual cards and advanced DAX modeling. The report concludes with an interactive scenario directory that enables users to filter, compare, and optimize travel plans side-by-side based on budget, departure origin, and route directness.
This Power BI dashboard was created for the FP20 Analytics Challenge in September 2026
ZoomCharts visuals used





Mobile view allows you to interact with the report. To Download the template please switch to desktop view.
