Feel free to leave your vote:
0
Share template with others
Summary
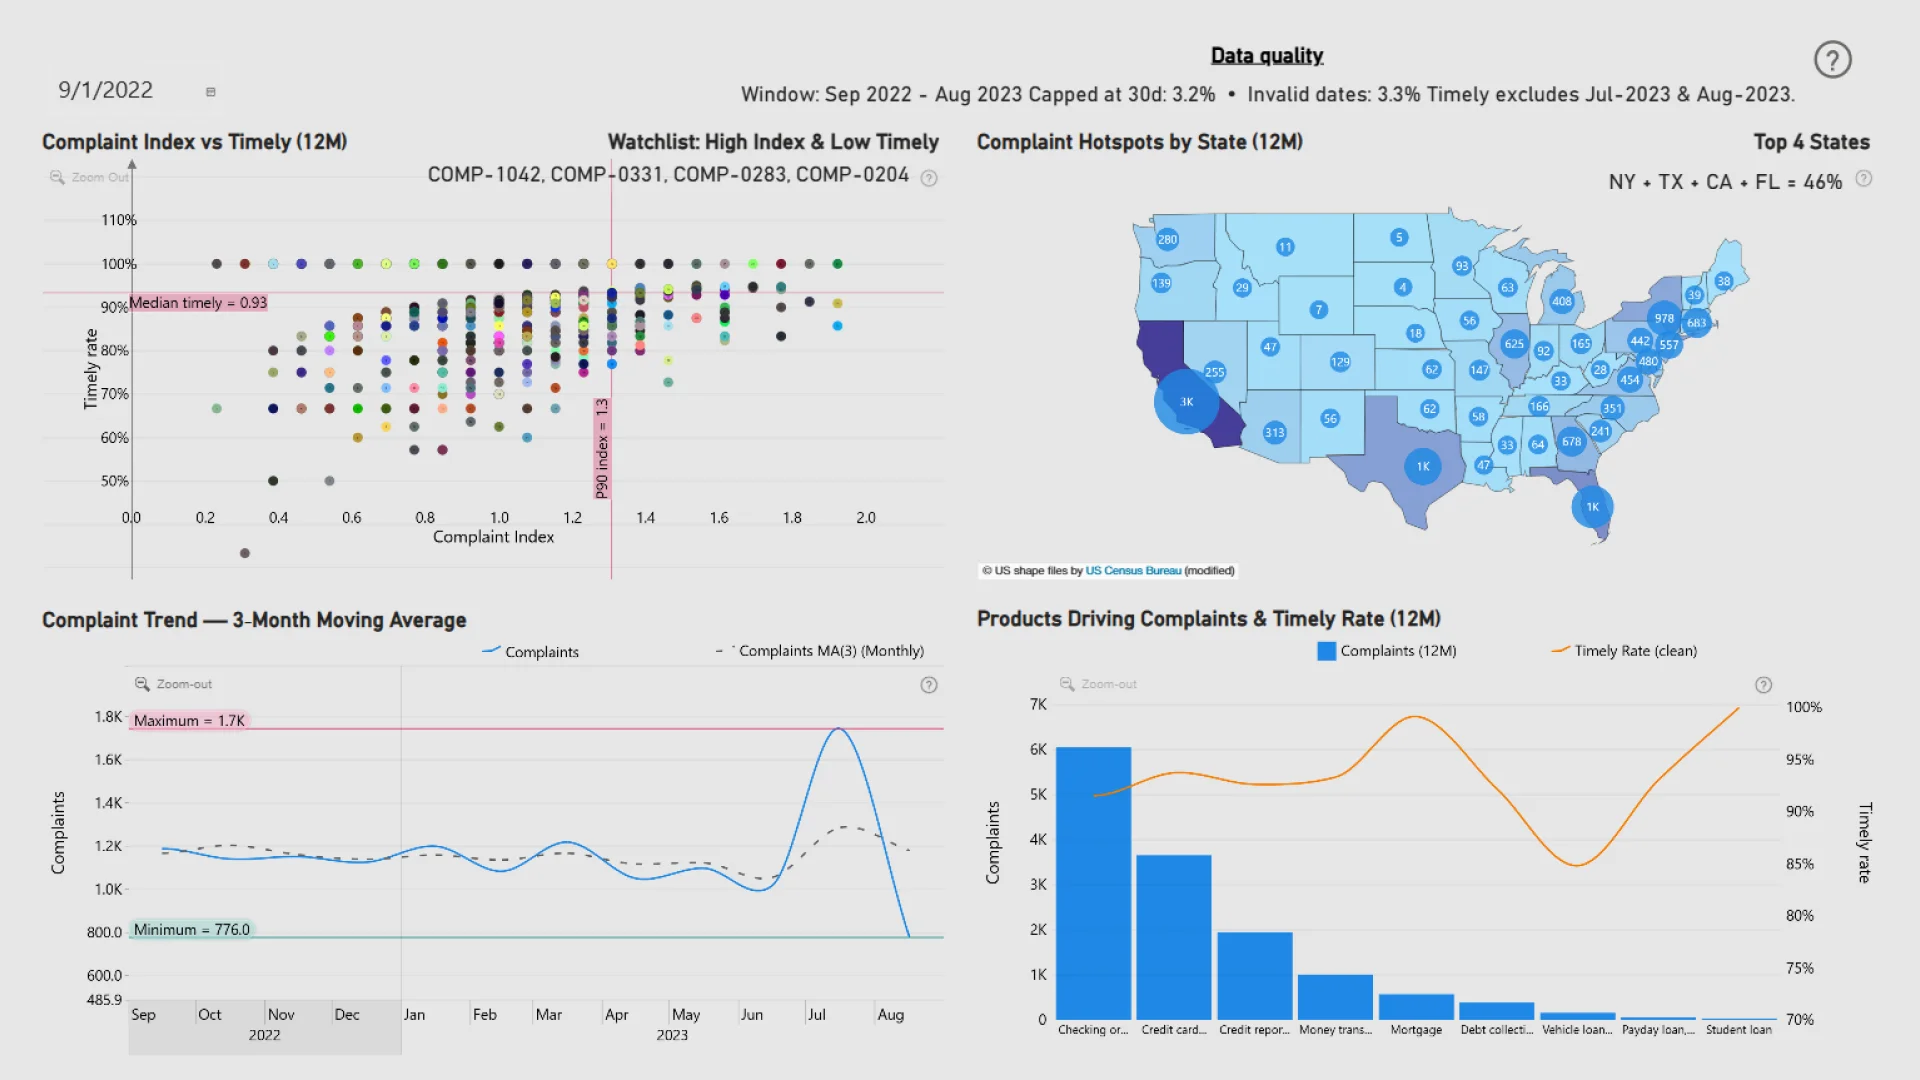
This Power BI report uses the Consumer Financial Complaints Dataset and features ZoomCharts Drill Down PRO custom visuals for Power BI. It was submitted to the Onyx Data DataDNA ZoomCharts Mini Challenge in October 2025.
Author Description:
Single-page Power BI report built with ZoomCharts Drill Down PRO (Scatter, Shape/Map, TimeSeries, Combo). Covers the period from September 2022 to August 2023. Key features include a dynamic watchlist (Index ≥ P90 & Timely ≤ median), state-level complaint hotspots (Top 4 by share), a 3-month moving average trend, and a product-by-timeliness comparison (0–100%). The report also includes an interactive help overlay and a data-quality banner highlighting the 30-day cap, invalid dates, and timely coverage notes.
ZoomCharts visuals used
Mobile view allows you to interact with the report. To Download the template please switch to desktop view.