Registration Open
Registration Open
04 April | 21:00
-
Reset your password
We'll email you instructions on how to reset your password
Are you ready to develop an expert-level HR analysis report? Learn with us in Challenge 15!
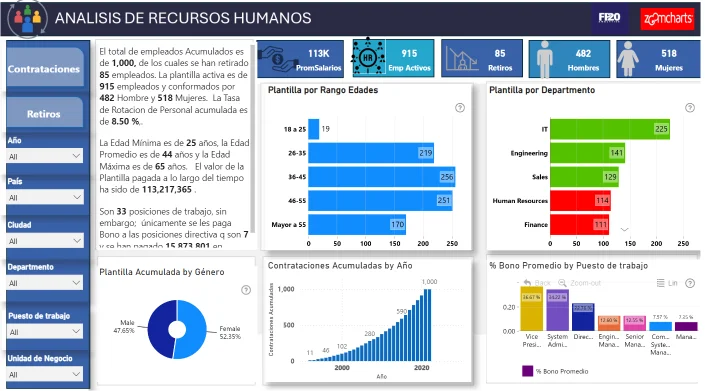
Workshop | How to Leverage ZoomCharts for Data-Driven HR Decisions
Workshop | How to Leverage ZoomCharts for Data-Driven HR Decisions
16 April | 11:00
-
Webinar | Learn from the Best HR Reports: ZoomCharts TOP Picks
Webinar | Learn from the Best HR Reports: ZoomCharts TOP Picks
13 May | 11:00
04 April - 04 May
Want to learn to build PRO reports? With personalized feedback and informative workshops, this is your opportunity to take your report-building skills to the next level, build your professional portfolio, and network with like-minded people.
The ZoomCharts challenge is hosted in partnership with FP20 Analytics – a group that unites passionate and inspiring data enthusiasts, and helps new data analysts improve their skills and build a competitive portfolio. Join in and sharpen your skills together with this open and friendly data community. Read more about the challenges on the FP20 Analytics website. Join the community on LinkedIn.
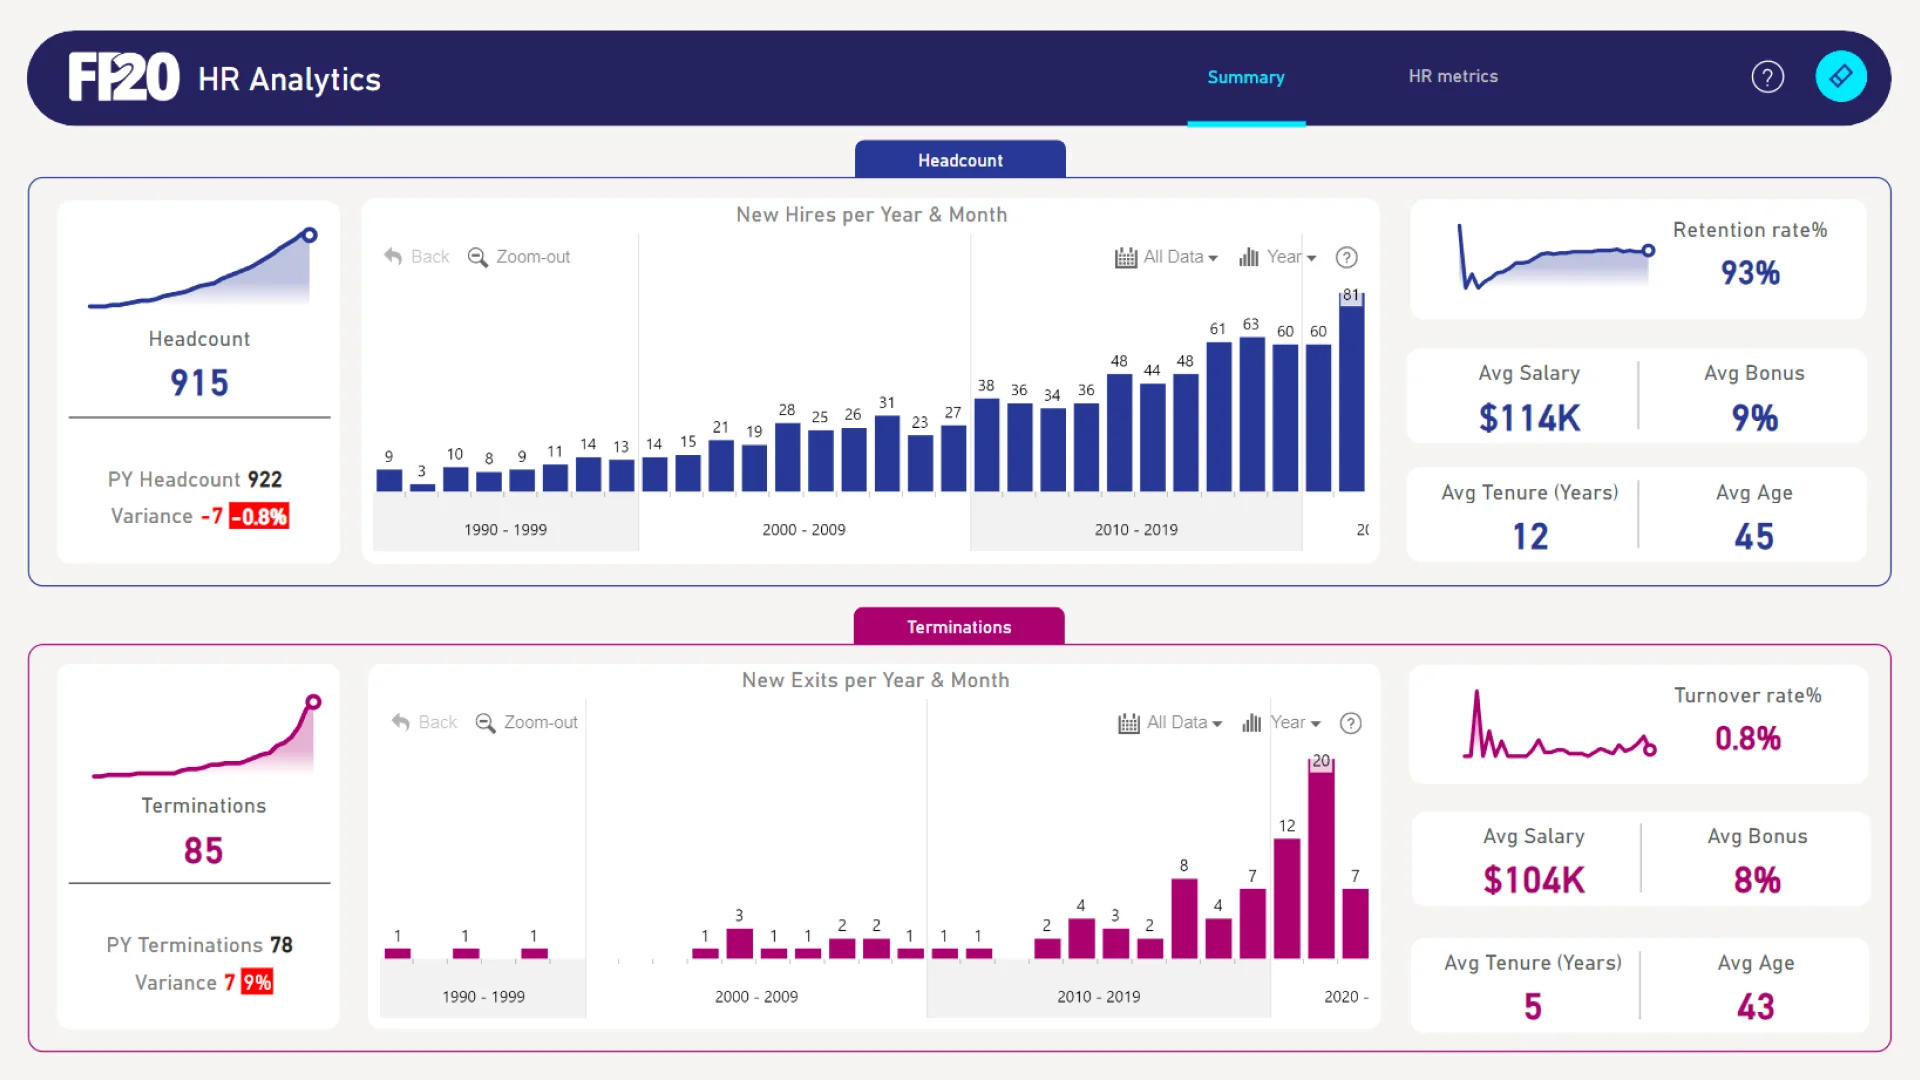
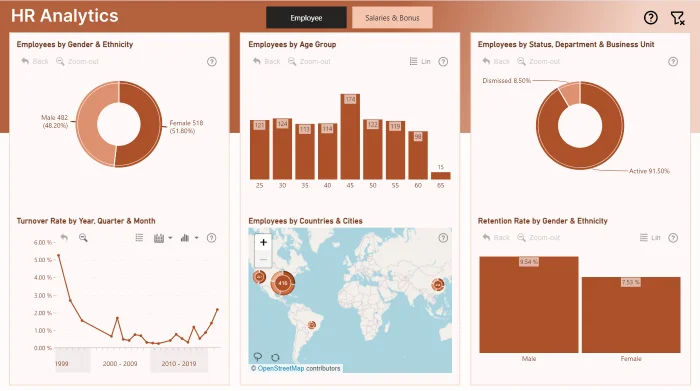
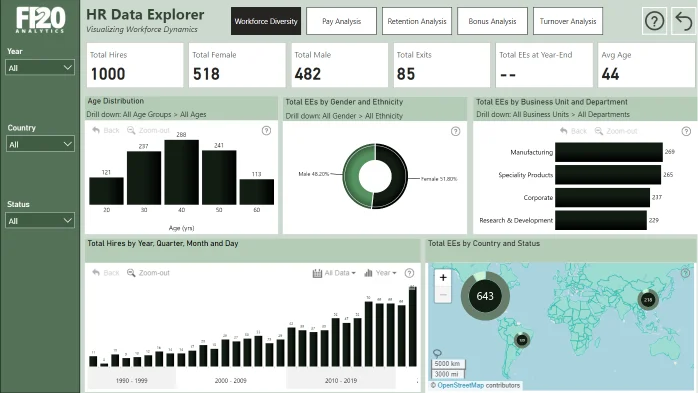
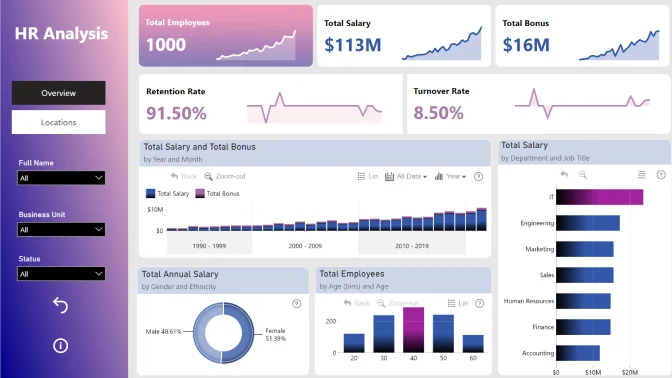
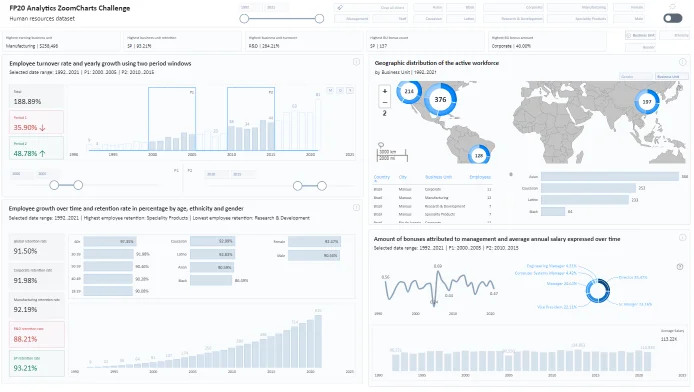
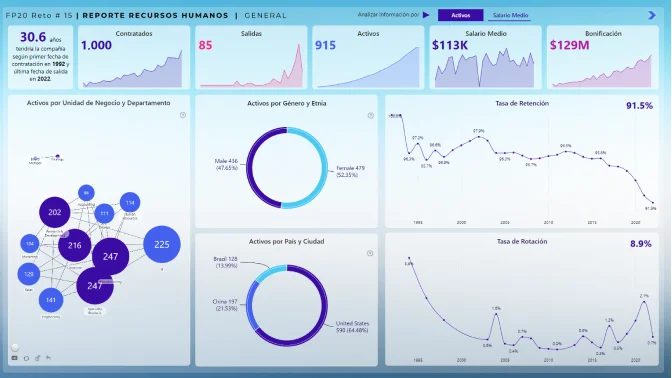
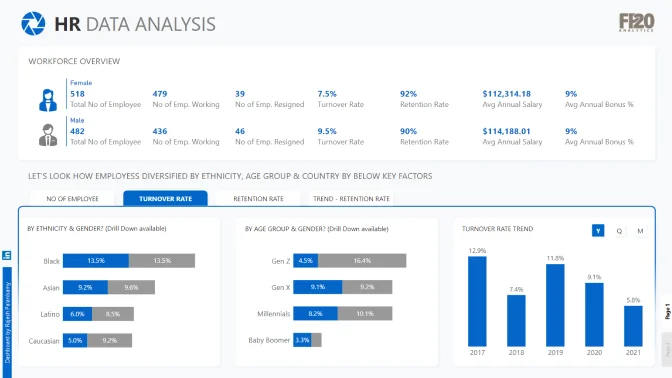
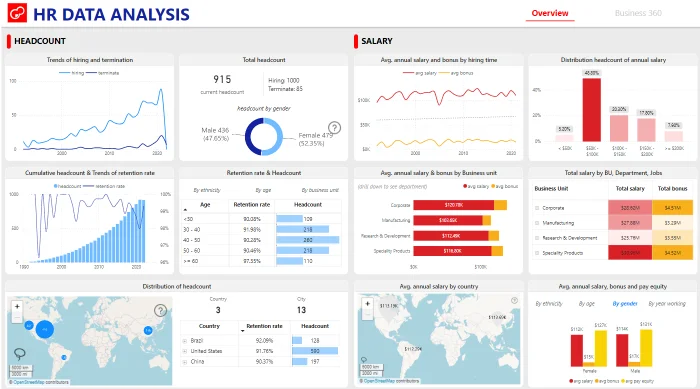
Participate in FP20 Analytics ZoomCharts Challenge to enrich your skill in creating PRO reports that help business users explore data quickly and intuitively.
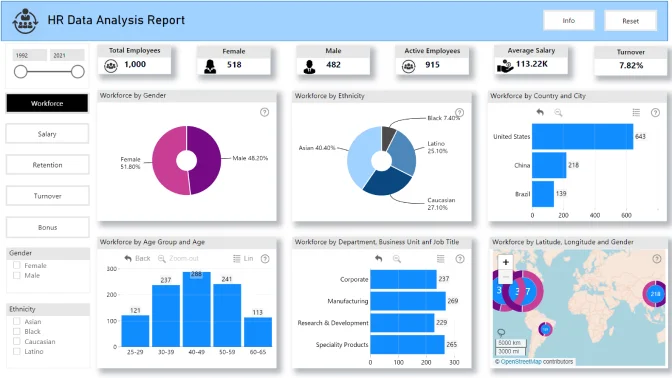
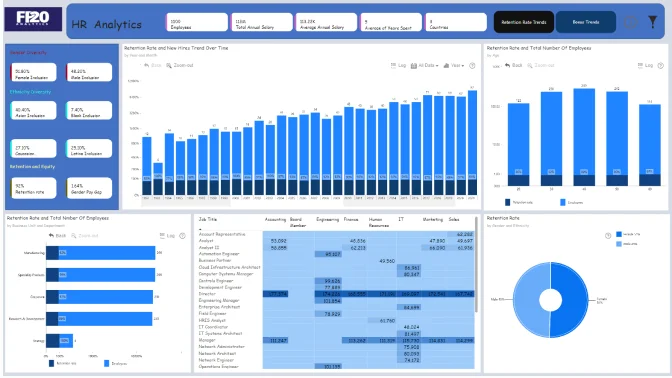
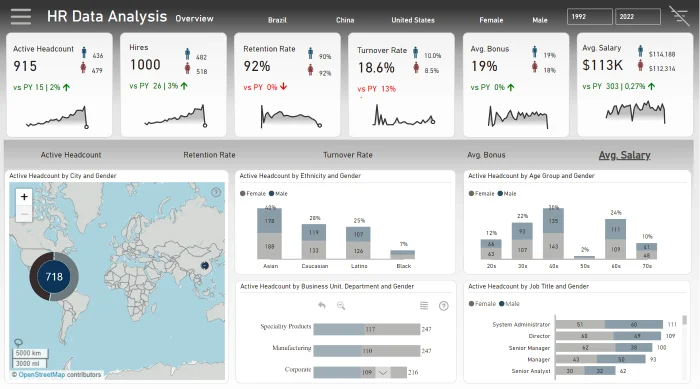
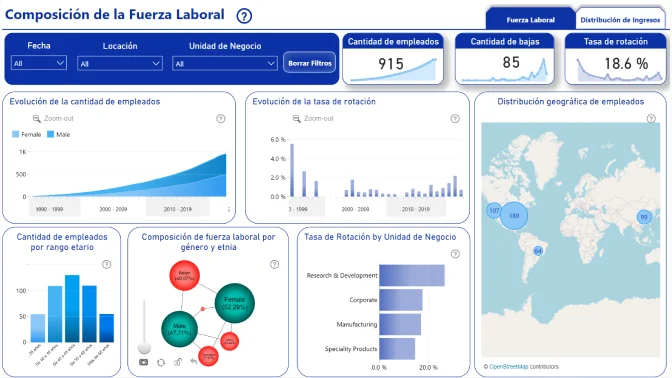
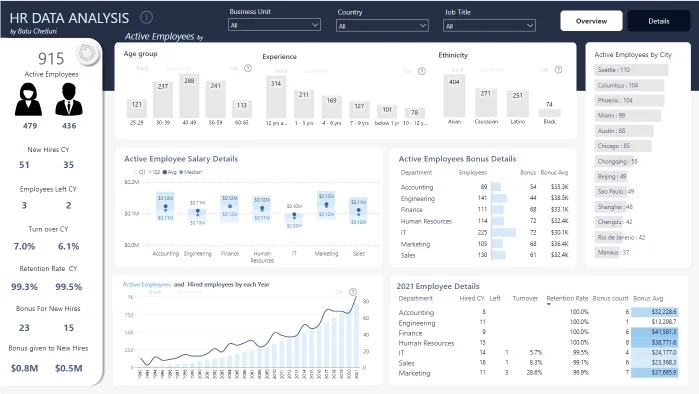
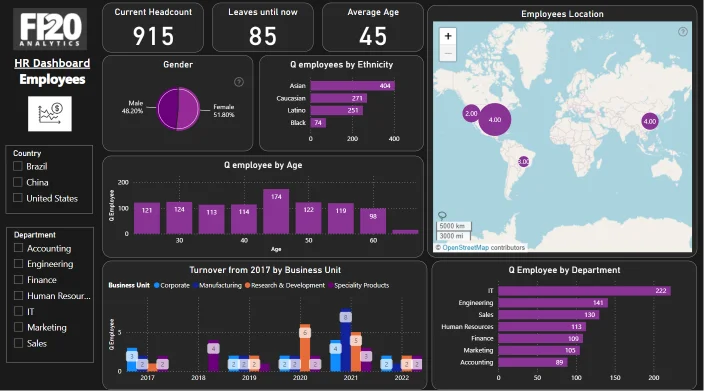
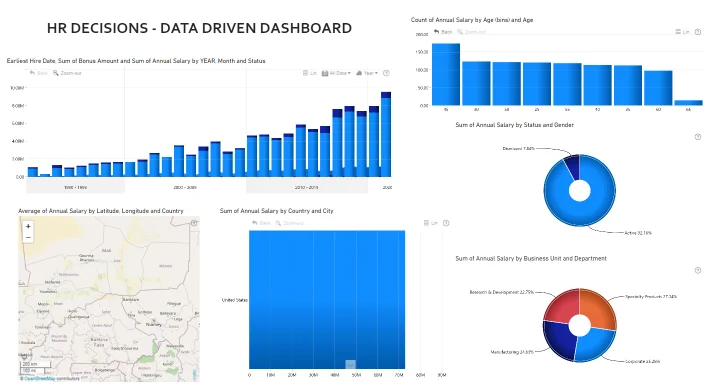
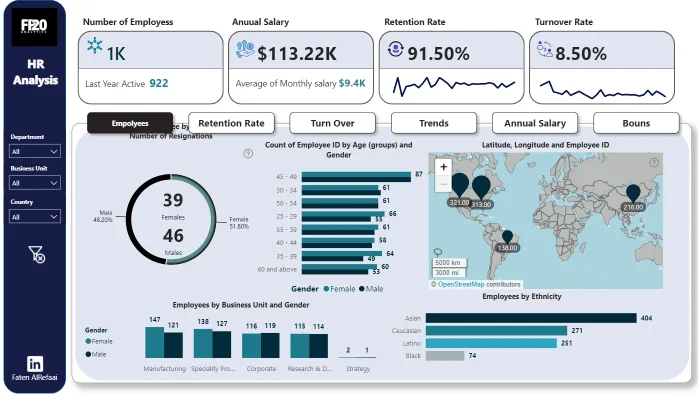
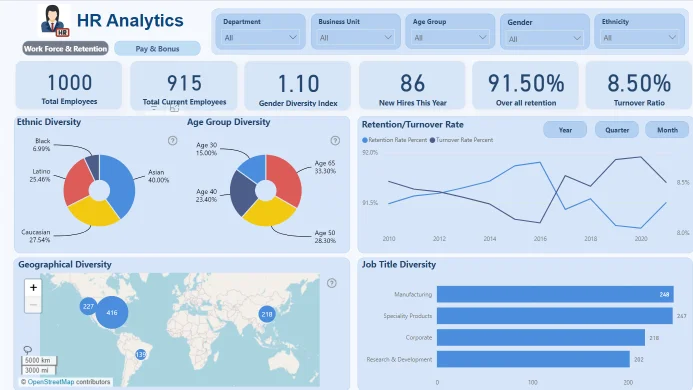
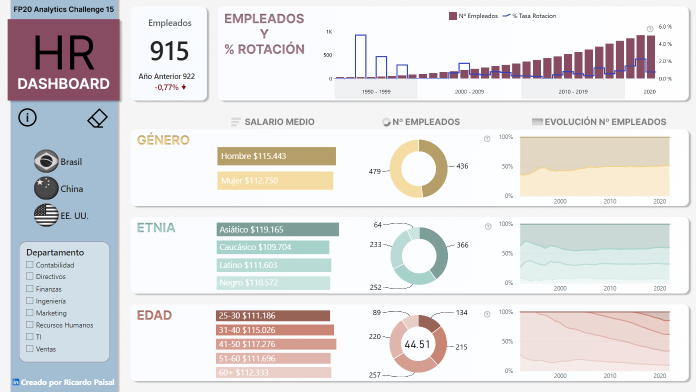
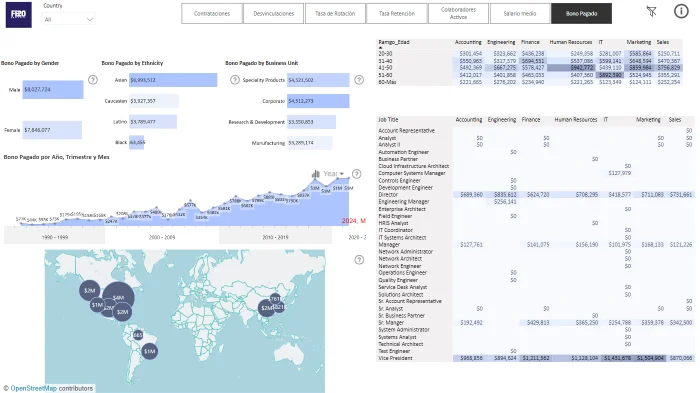
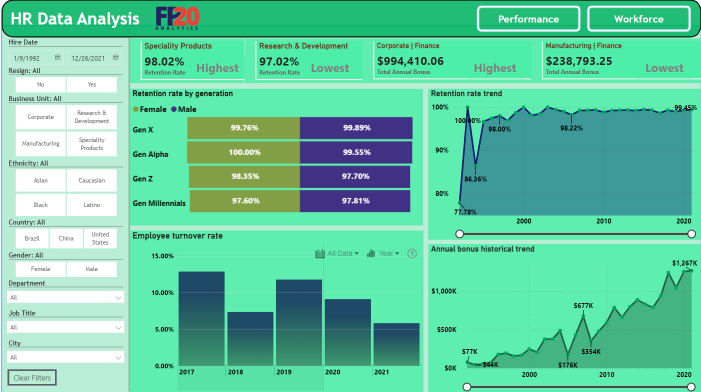
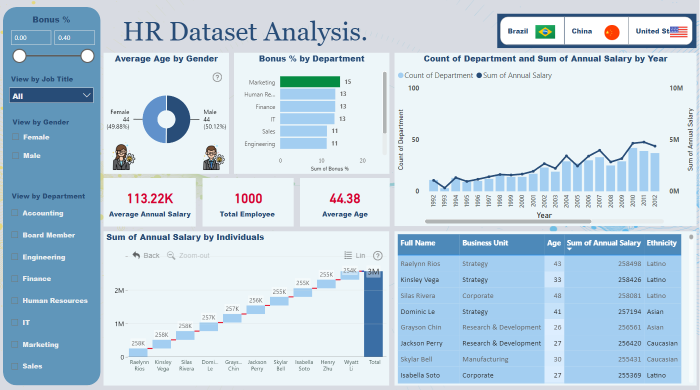
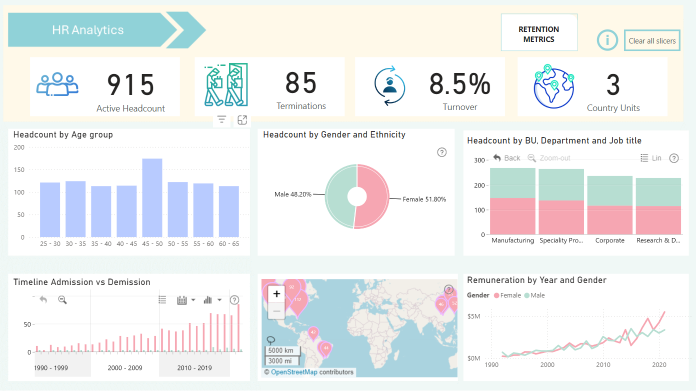
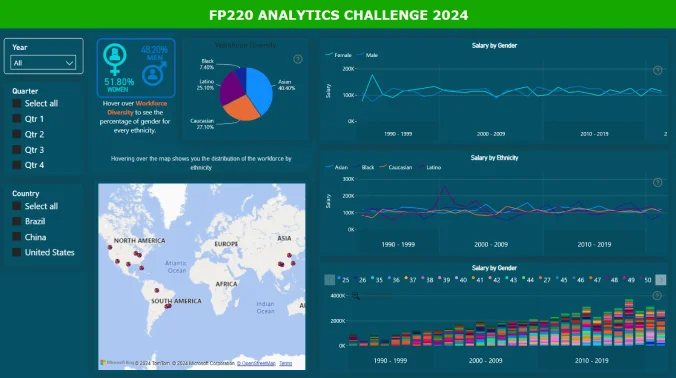
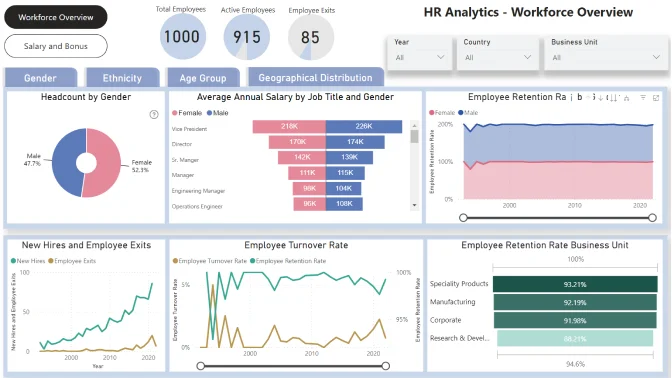
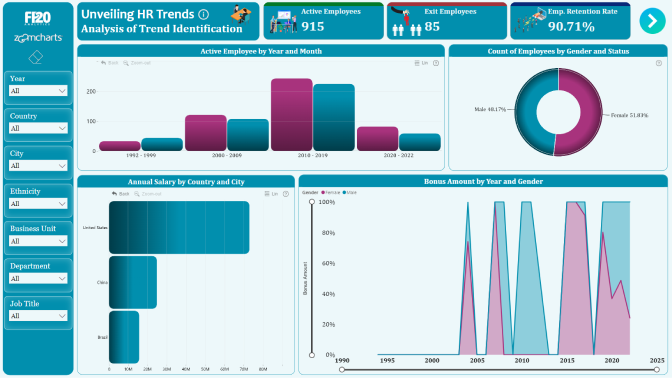
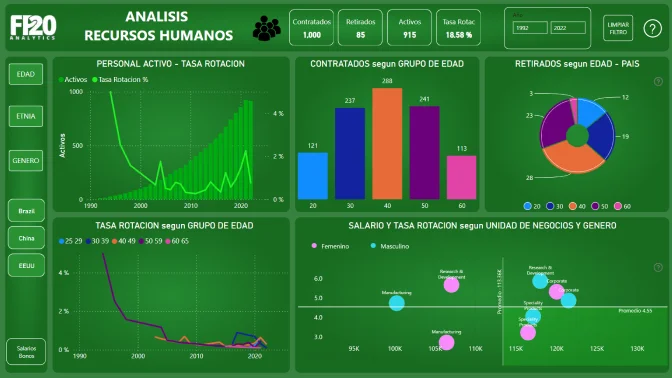
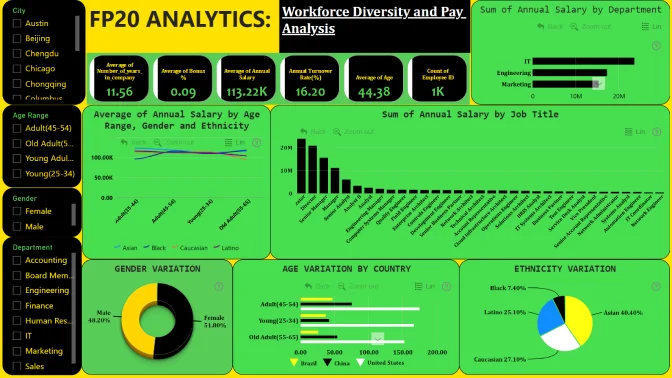
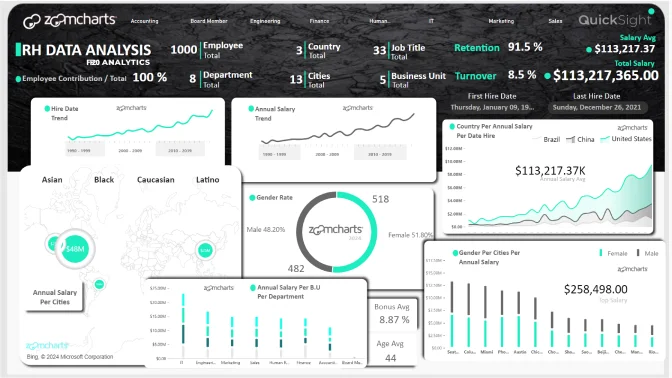
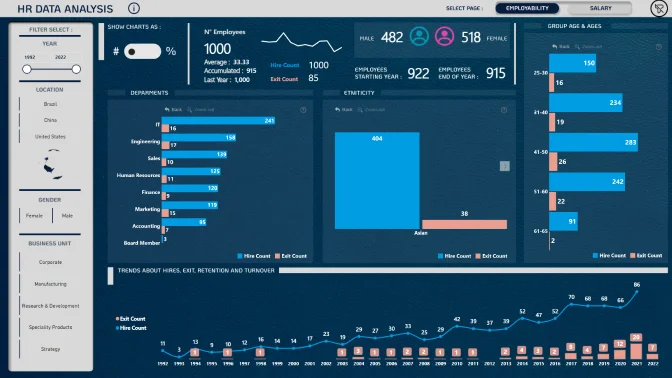
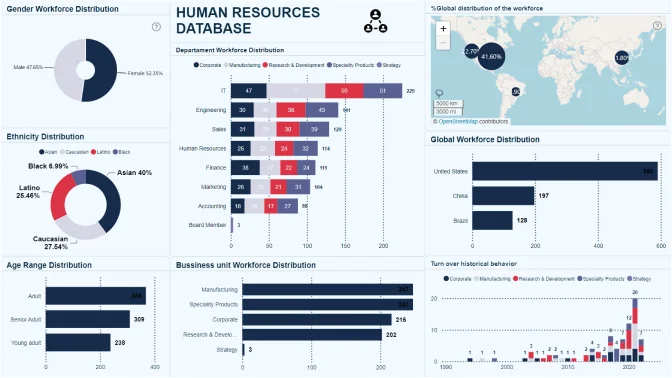
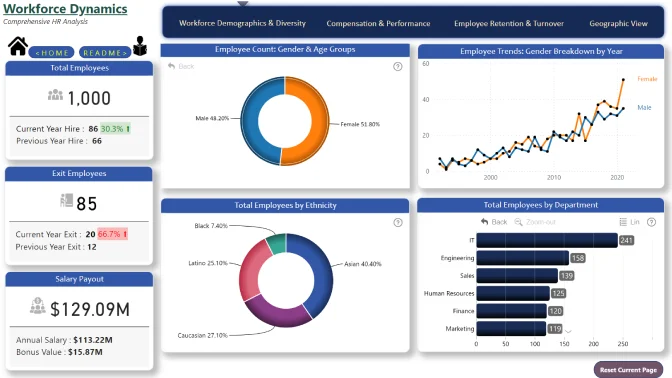
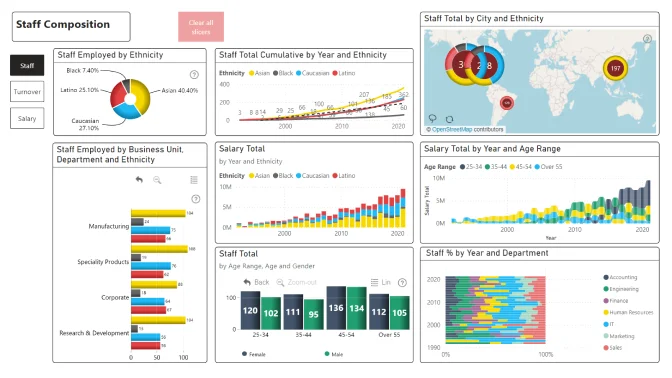
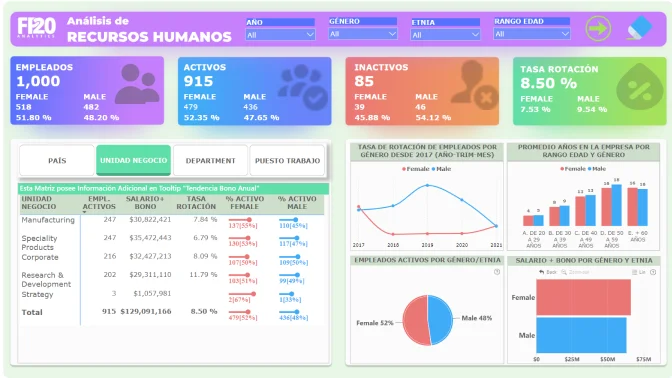
💼 FP20 Analytics ZoomCharts Challenge 15 is your chance to shine by demonstrating your HR management analysis skills, as this time we'll delve into identifying trends within a Human Resource dataset.
The best report’s creator will receive a $300 Amazon gift card from ZoomCharts. The winner will be announced in a special live webinar session on May 13, where we will review the top entries from the challenge.
Note: If you opt to post your report on NovyPro, for instructions on how to do this, refer to the provided video link.
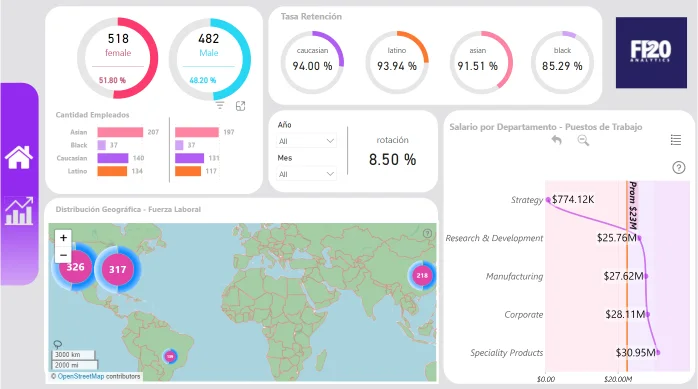
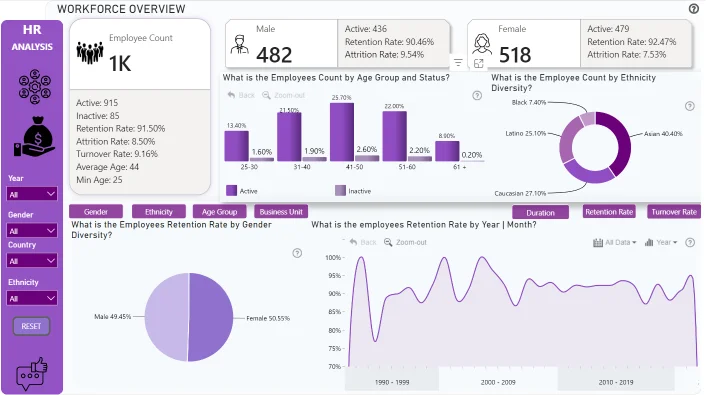
NovyPro: https://www.novypro.com/In Challenge 15 we will be identifying trends within a Human Resource dataset.
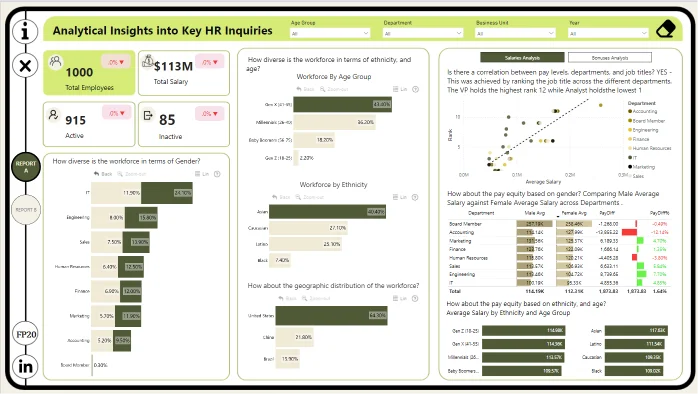
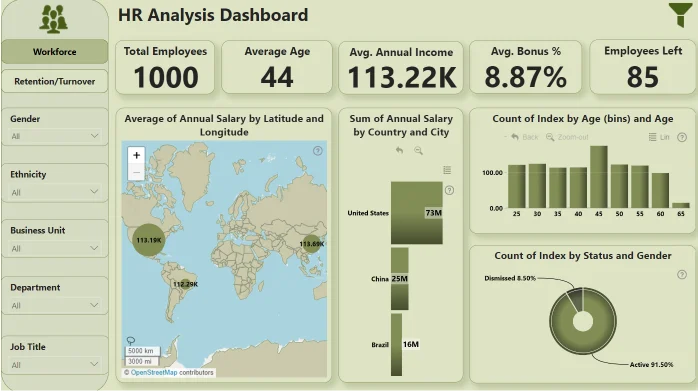
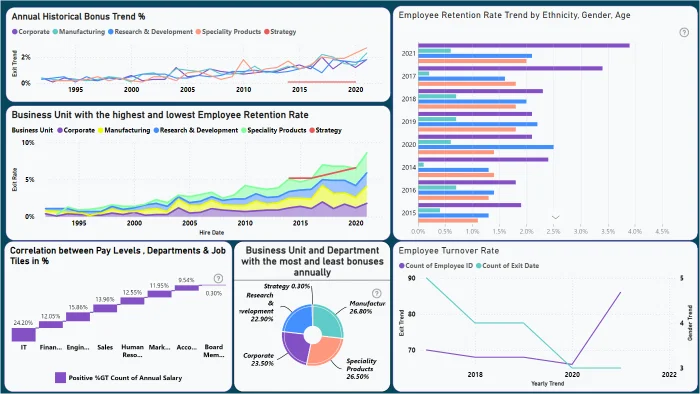
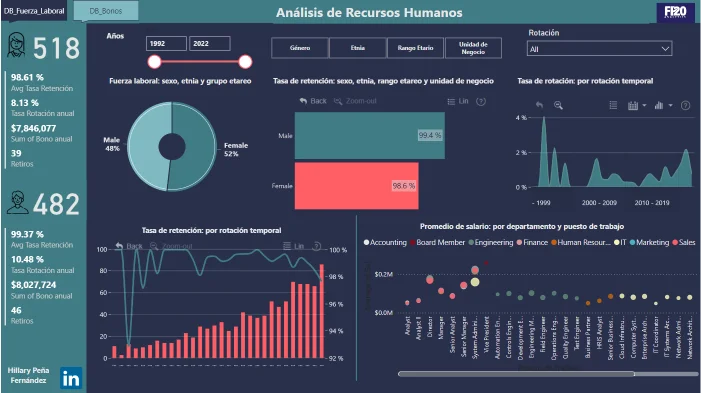
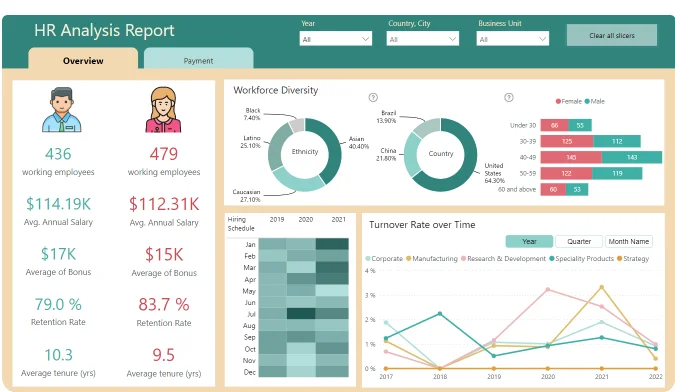
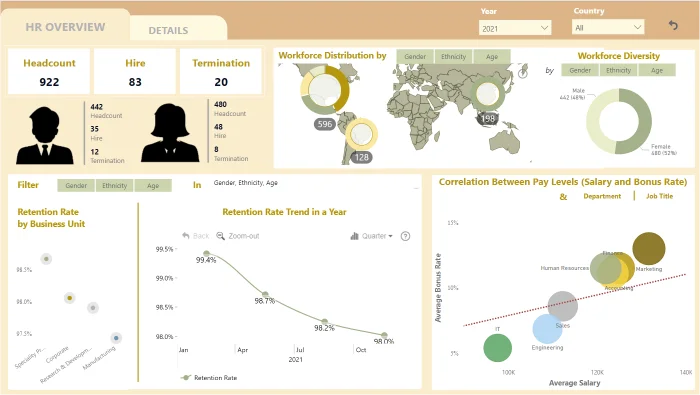
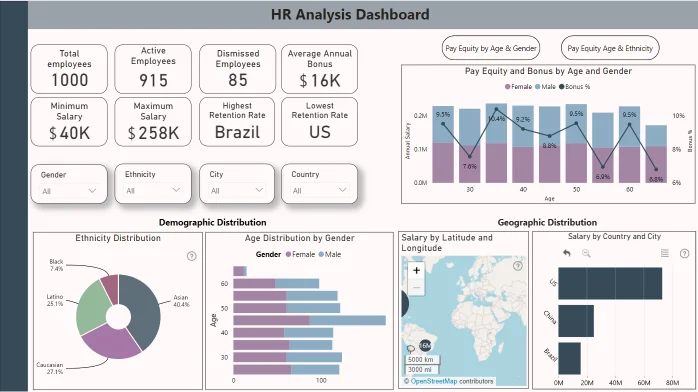
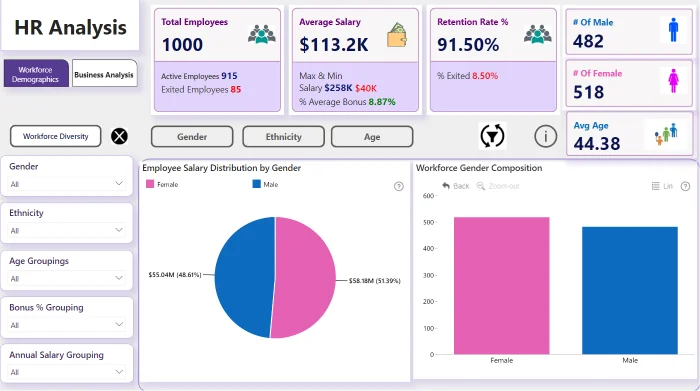
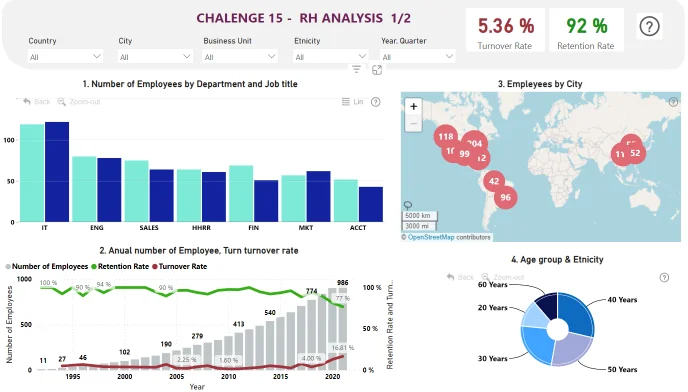
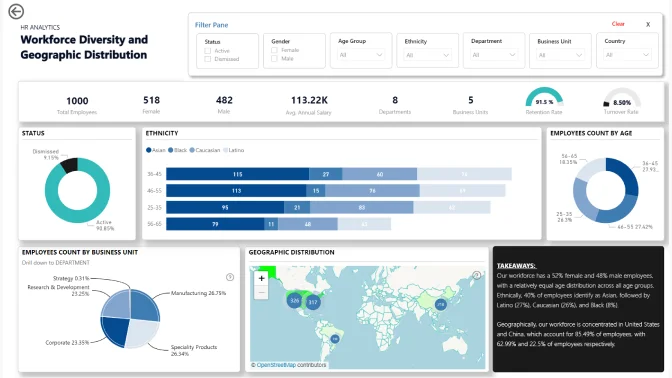
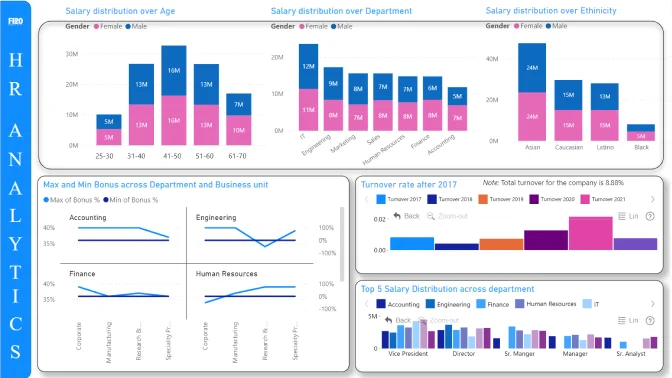
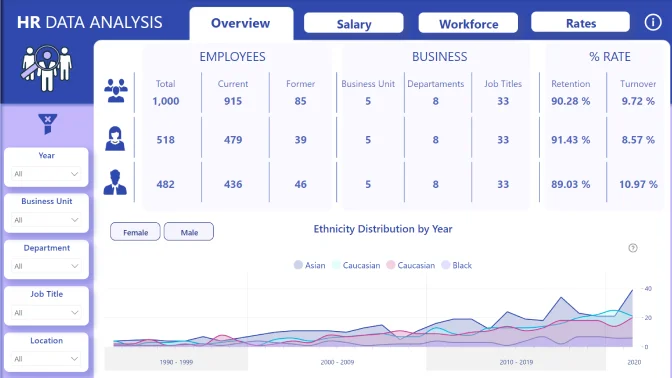
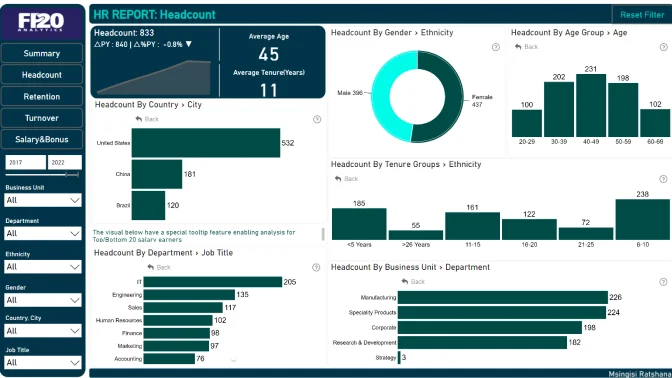
Create a report that allows end users to easily find answers to the following questions:
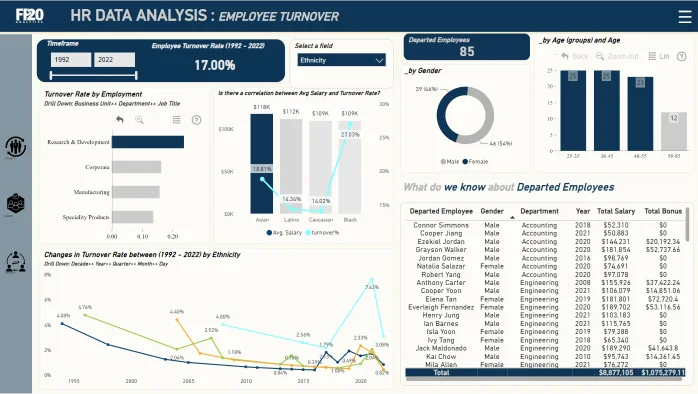
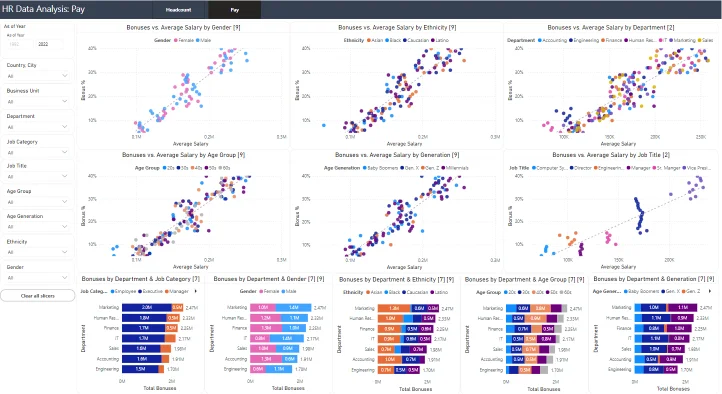
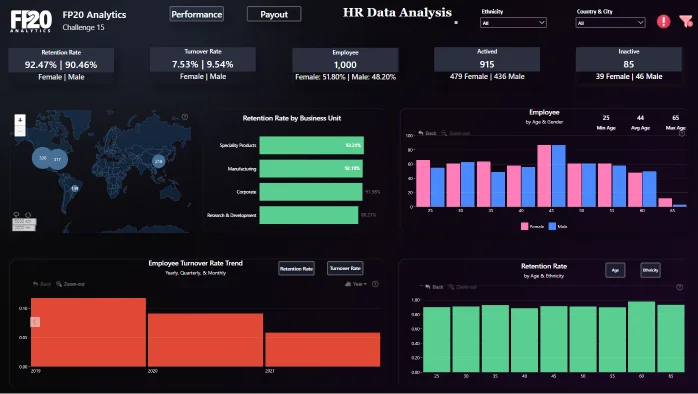
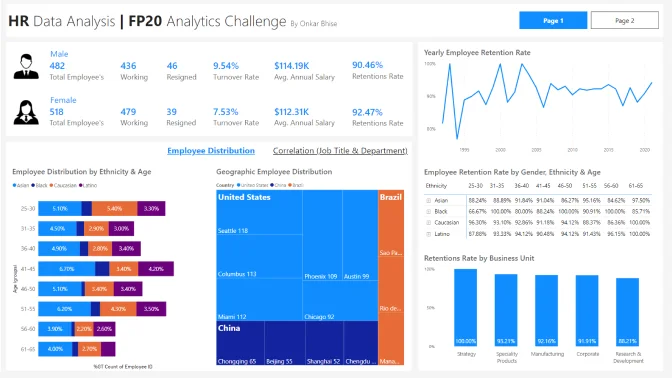
Use the formula: Apply the following formula to calculate the turnover rate:
Employee Turnover Rate — (Number of Separations / Average Number of Employees) ×100.
For example, if a company had 50 employees at the start of the year, 55 at the end, and 5 separations occurred during the year, using the formula:
Turnover Rate= (5/52.5)×100≈9.52%
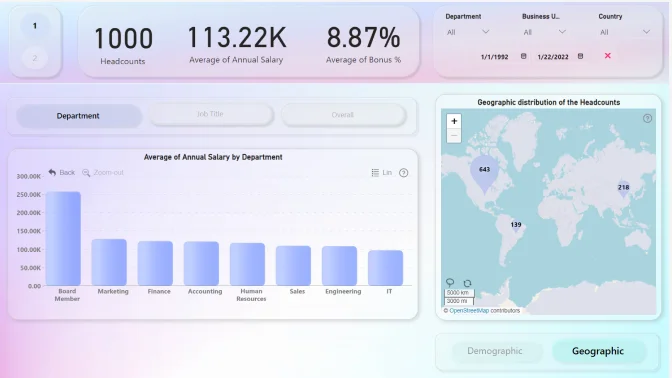
Business users use reports to make data-driven decisions. That’s why reports are called effective if they enable users to drill down and filter data quickly and intuitively to find answers to any question they might have and analyse data in all possible directions and dimensions. We will evaluate:
You are encouraged to use various techniques at your disposal, such as tooltips, drill-throughs, drill-downs, cross-chart filtering and page navigation features, to enhance your analysis.
Workshop | How to Leverage ZoomCharts for Data-Driven HR Decisions
Workshop | How to Leverage ZoomCharts for Data-Driven HR Decisions
16 April | 11:00
-
Webinar | Learn from the Best HR Reports: ZoomCharts TOP Picks
Webinar | Learn from the Best HR Reports: ZoomCharts TOP Picks
13 May | 11:00
04 April - 04 May