Feel free to leave your vote:
2
Share template with others
Summary
Report submitted for FP20 Analytics ZoomCharts Challenge 15 (April 2024). The report was built with the HR Analysis dataset and includes ZoomCharts custom Drill Down PRO visuals for Power BI.
Author's description:
In my opinion, a dashboard should solve at least one problem.
Problem & Role: For this challenge, I envisioned a problem where a few employees were unsatisfied with the recent bonus distribution. As a member of the HR department, I aim to understand this issue better and provide suggestions for the next appraisal regarding bonuses.
Understanding the Dataset: The dataset contains basic information about employees (employee ID, name, location, role, department, annual salary, and bonus percentage). To ensure robust analysis, I've introduced a composite primary key by combining both the EEID and full name fields. This decision was prompted by the presence of duplicate entries for these attributes within the dataset. Given the absence of relational dependencies based on other keys, this approach serves to enforce uniqueness effectively. Moving forward, it's advisable to conduct thorough verification checks for both names and EEIDs. This verification step is crucial for maintaining data accuracy and reliability, thus enhancing the overall quality of our dataset.
Pages:
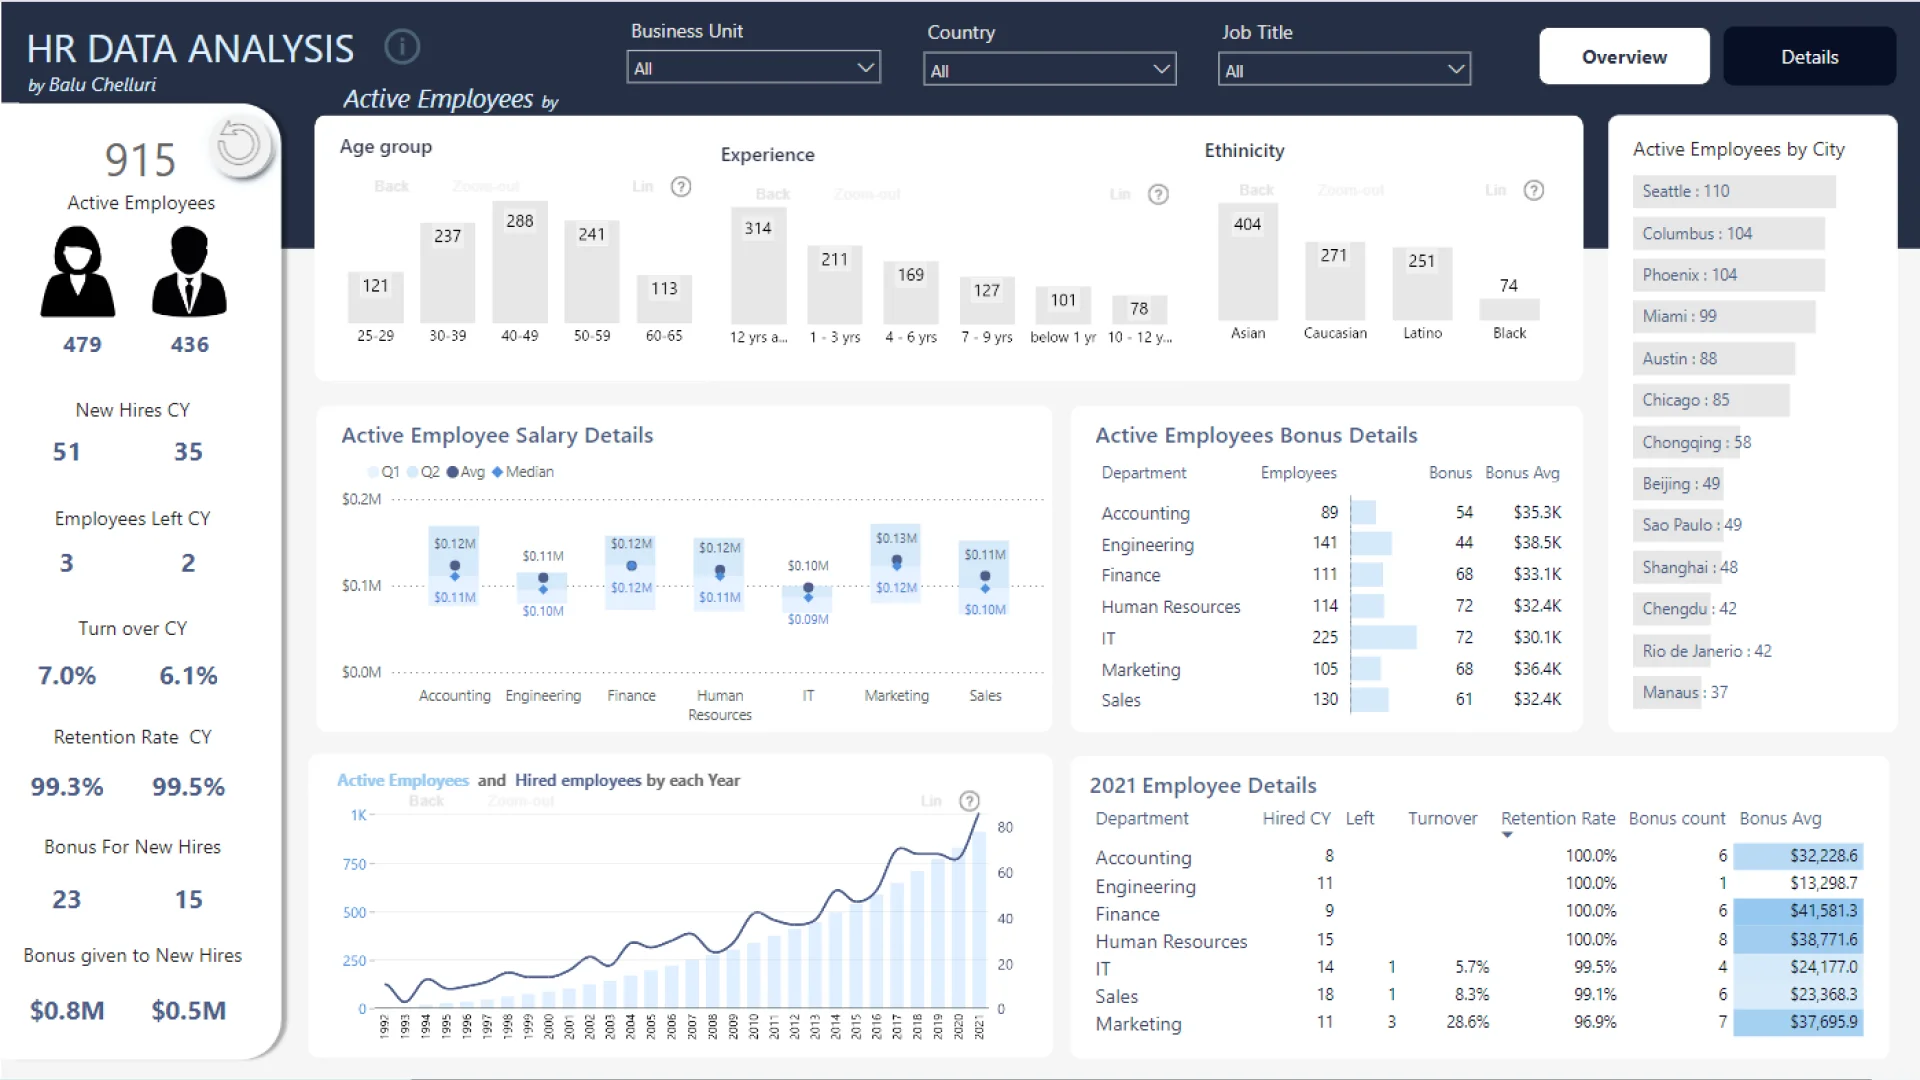
Overview: This page provides an outline of employee KPI performance for male and female employees, including retention rate, turnover, hiring, and departures, along with bonus details. It also displays active employees by business unit, age group, experience, ethnicity, and city, along with salary and bonus information. Additionally, KPI details are provided by department.
Details: The Details page offers detailed information for the selected year, including hired and departed employee details, KPI performance for male and female employees by the selected year, and bonus details. The bottom part primarily focuses on bonus details, providing information about employees who have not yet received their bonuses and offering suggestions.
⭐Key Takeaway ⭐: "Management Bias: Favoring the Higher Ranks?"
To understand the distribution of bonuses, I've categorized them based on factors such as experience years, department, and business unit. However, upon analysis, it became evident that a clear pattern only emerged when considering job roles. Specifically, bonuses were consistently allocated to individuals in management roles across departments and business units. Out of 33 job roles, only 6 roles were given a bonus and these roles are mostly the Management ones. Consider Extend bonuses to long-serving employees who haven't received them yet, recognizing their loyalty and contributions. These are just suggestions. Since the dataset is limited, we don't know whether they are receiving other perks or stock options.
ZoomCharts visuals used
Mobile view allows you to interact with the report. To Download the template please switch to desktop view.