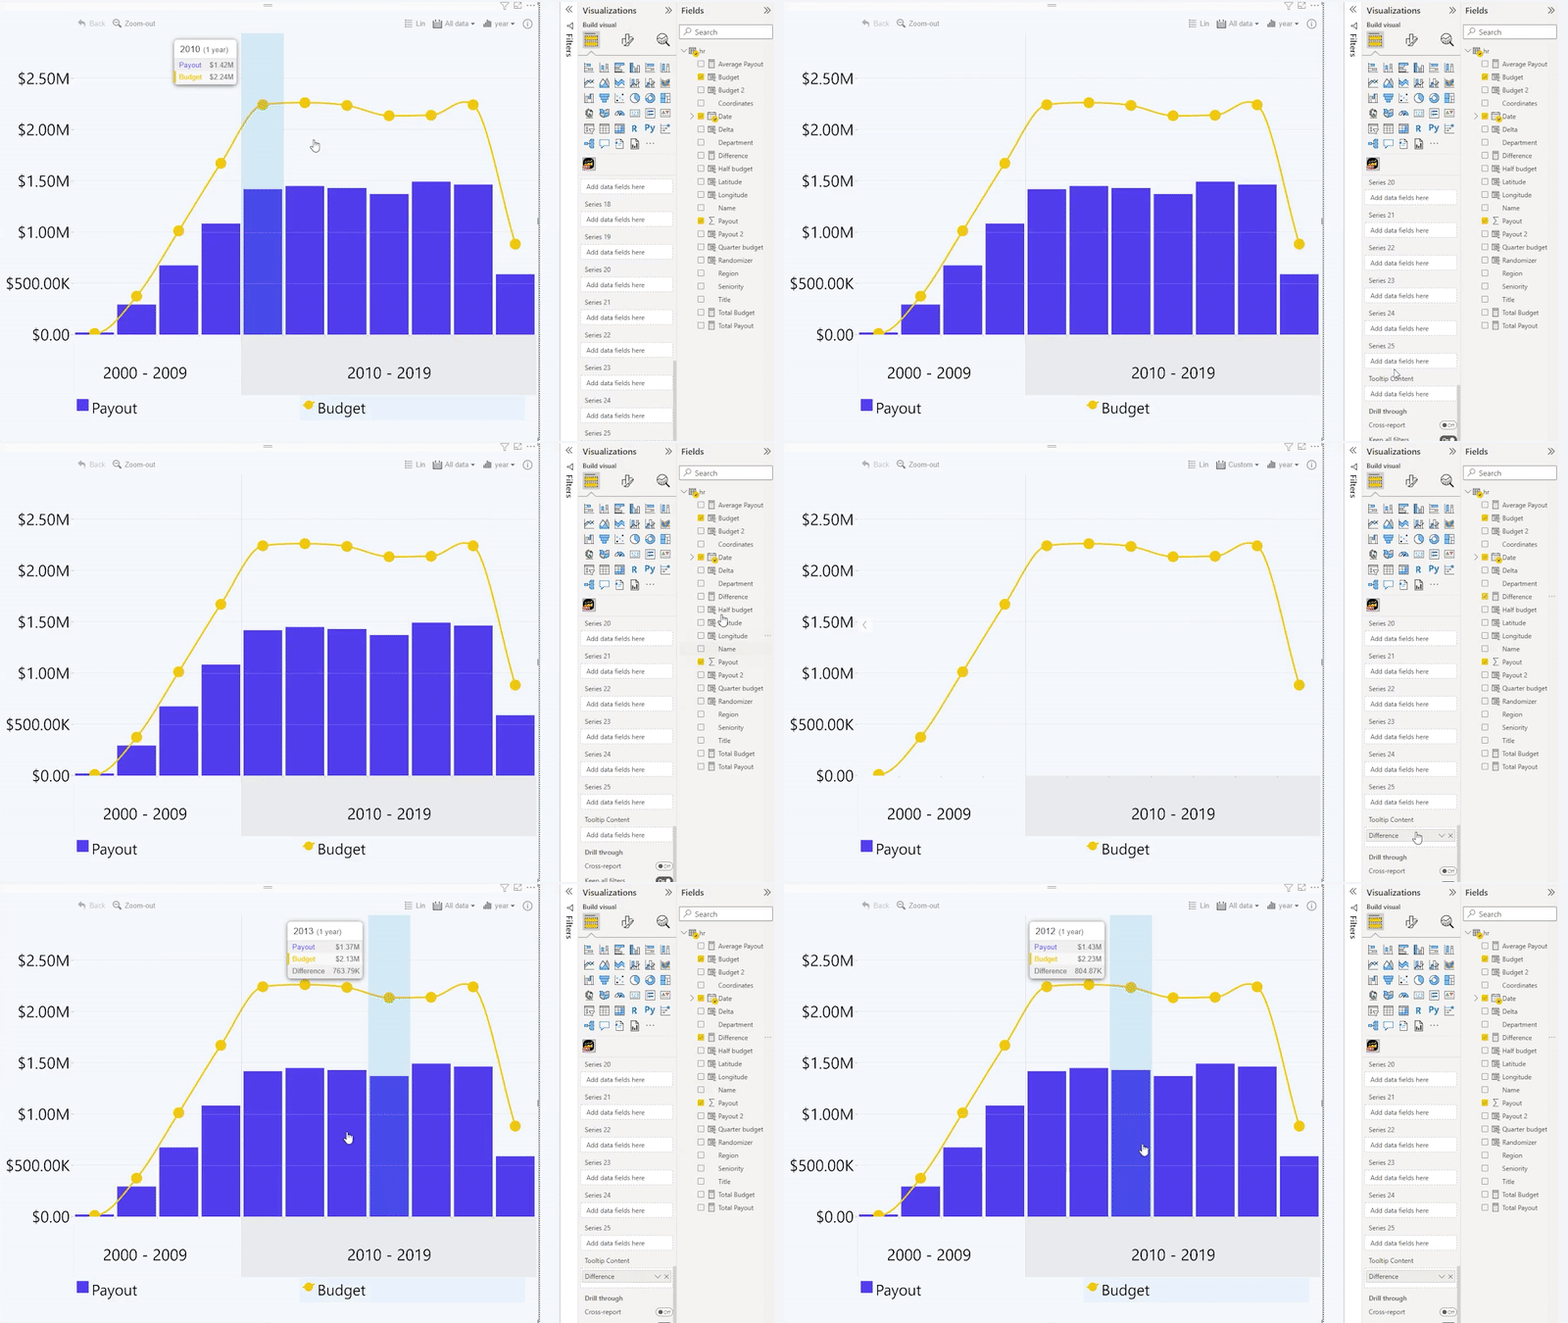
Tooltip Settings
Tooltips can be used to provide additional information to the user, and it can be accessed by hovering over the chart. Tooltips will display Series values and columns that you have included in the Tooltip Content field.
You can enable or disable tooltips with a toggle, and you can customize them further with the following settings:
- Tooltip Type
- Use Total Stack Value
- Display Units
- Value Decimals
- Percentage Decimals
- Hide Rows with No Data

You can adjust how the tooltip aggregates series values when the user selects multiple time units by enabling Multi-select Aggregation Override in the Series X Configuration section of each specific series or apply the same settings for all series using Multi-select Aggregation Override (Series Defaults).
Was this helpful? Thank you for your feedback!
Sorry about that.
How can we improve it?