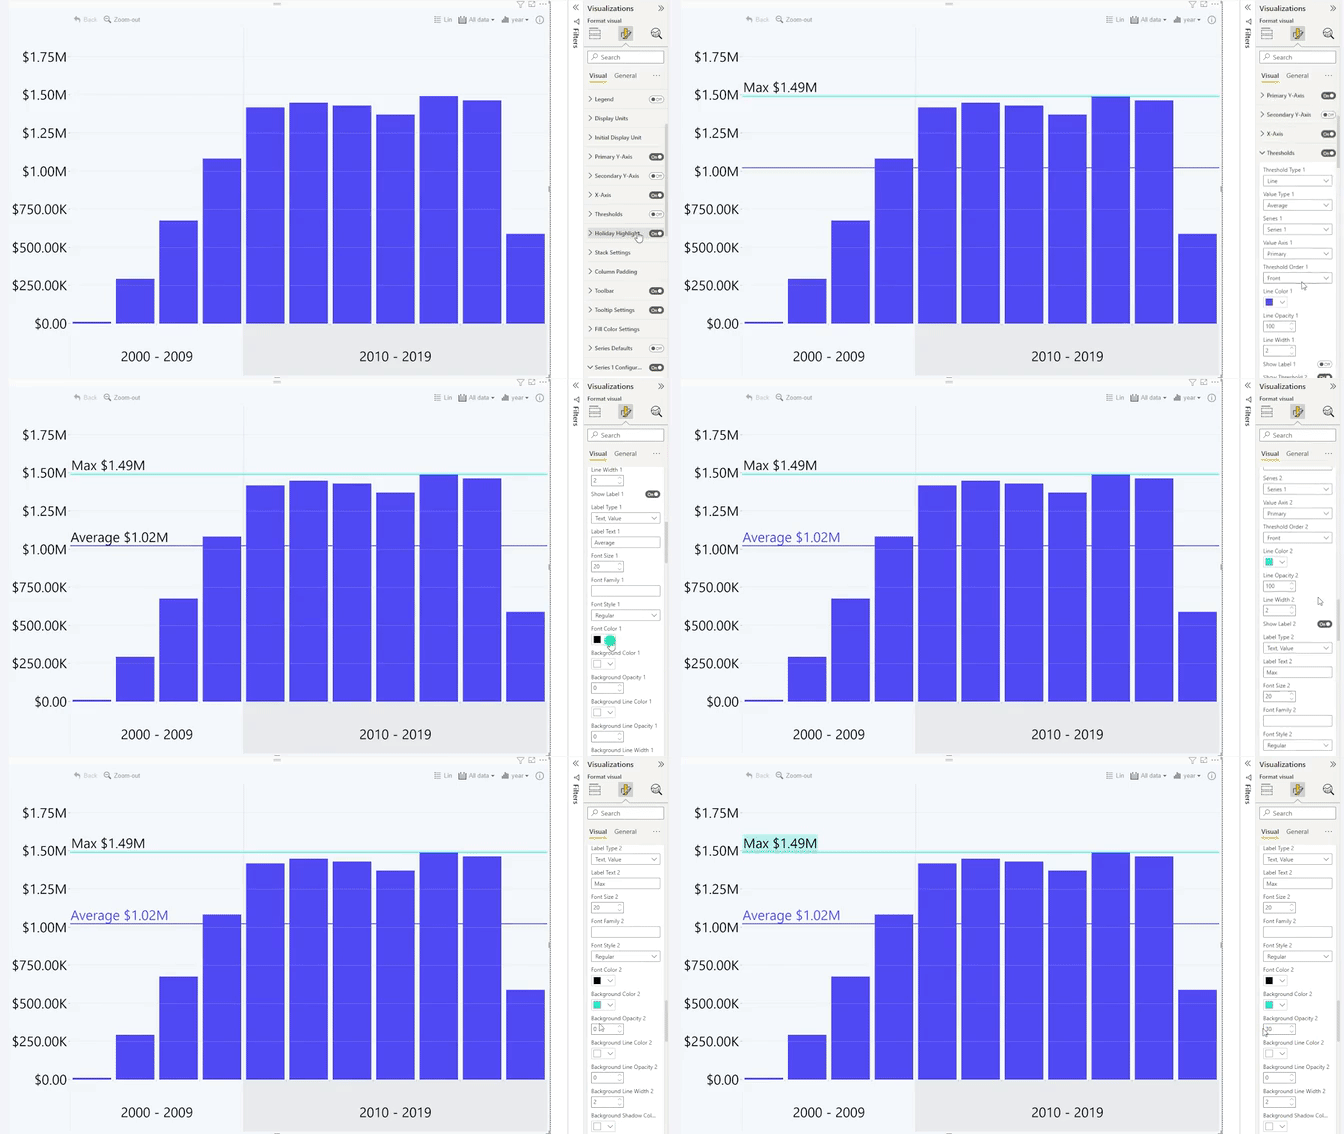
Line thresholds require just one value - From Value, which will be used to determine the line placement. Area and change thresholds require From Value and To Value - for area thresholds, they will be used to set the boundaries of the threshold area, but for change thresholds, both values will be compared and the difference will be visualized as an arrow.
Once Thresholds toggle is enabled, further configuration options will become available for Threshold 1:
- Threshold Type
- From-Value Type
- From-Series (available if From-Value Type is not 'Constant')
- To-Value Type
- To-Series (available if To-Value Type is not 'Constant')
- Value Axis
- Threshold Order
- Fill Color
- Fill Opacity
- Line Color
- Line Opacity
- Line Width
- Show Label (reveals additional settings once enabled)
- Show Threshold (2,3,4)
By default, enabling Thresholds toggle will add one threshold to the chart, and the settings will be applied to Threshold 1. You can add more thresholds by enabling the Show Threshold 2, 3, or 4 toggles. Each enabled threshold will reveal the same set of configuration options as listed above, which you can use to configure each threshold's settings independently.

Was this helpful? Thank you for your feedback!
Sorry about that.
How can we improve it?