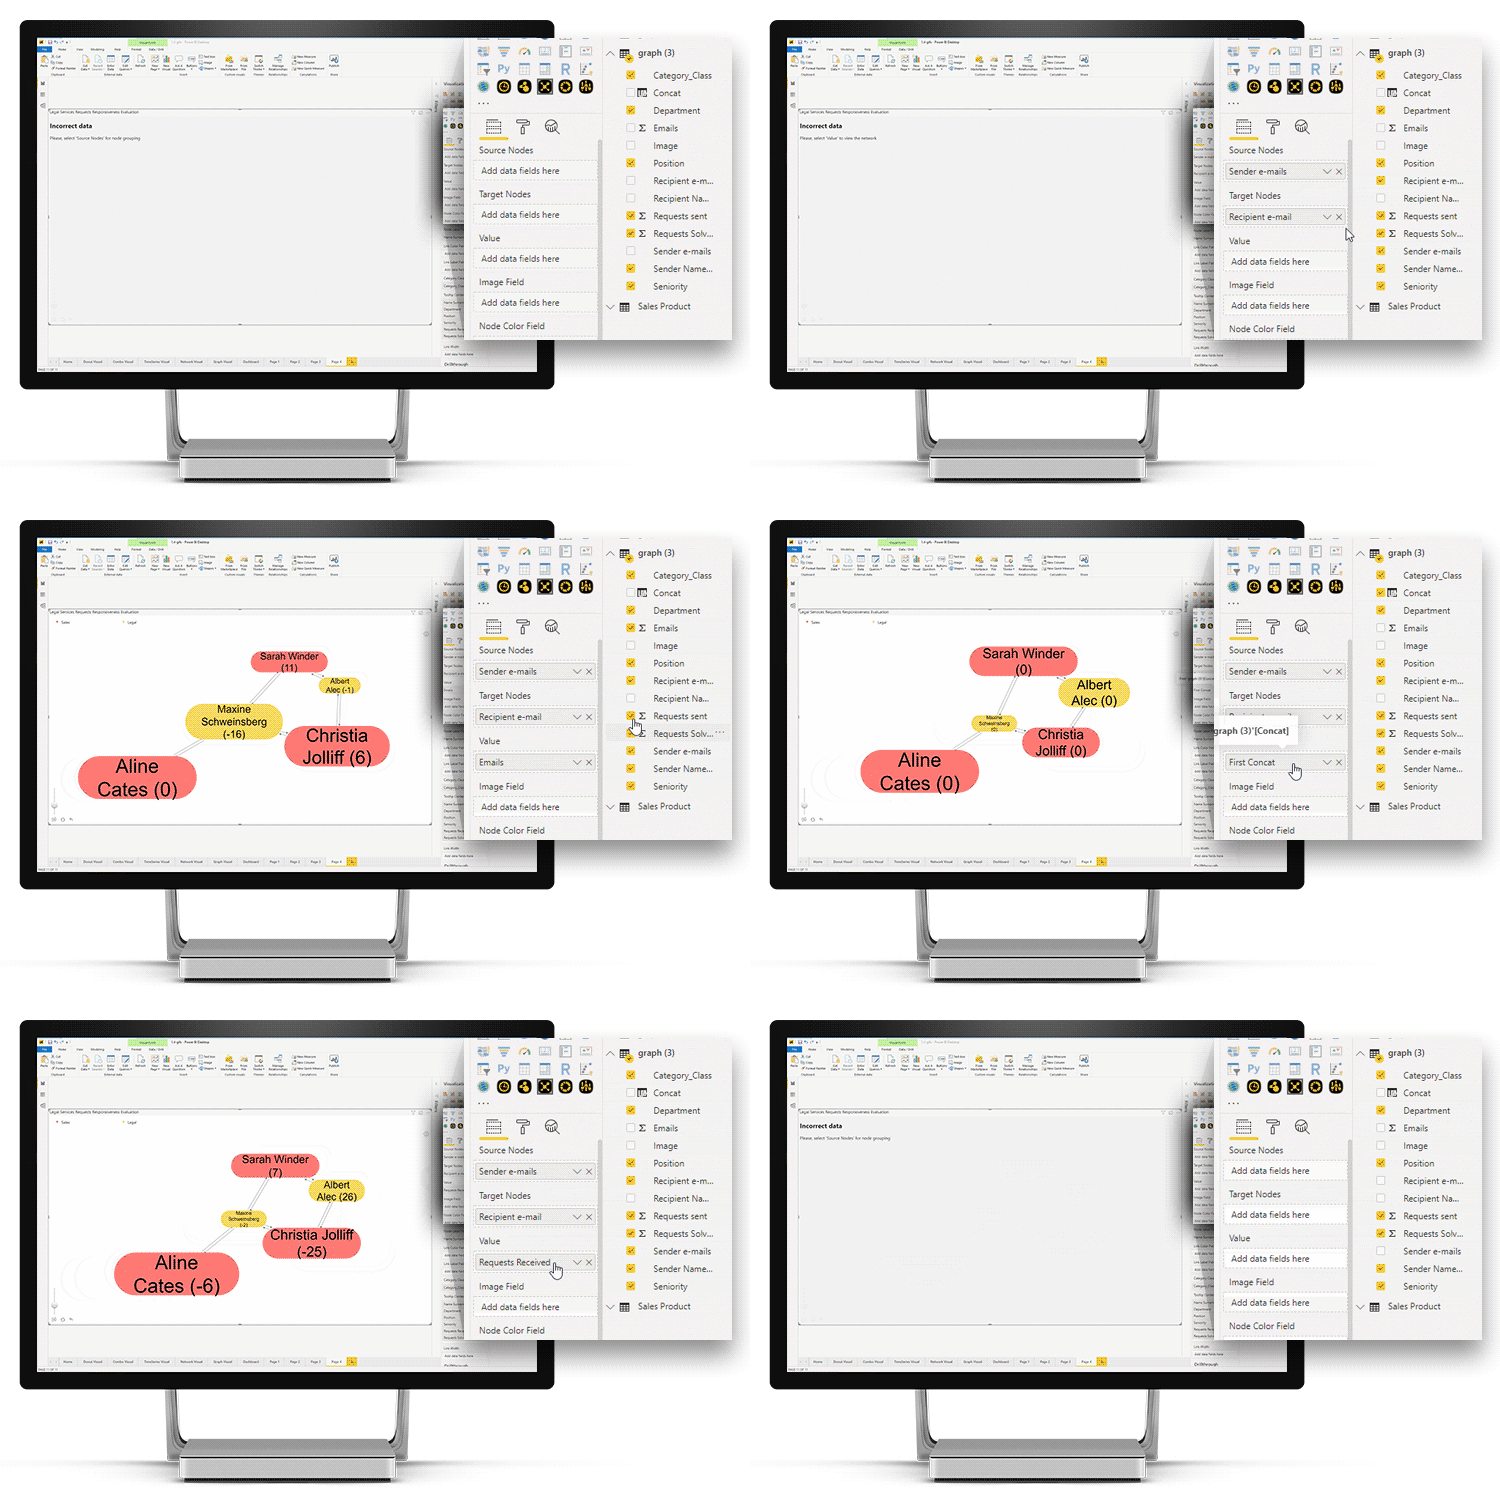
Graph-Structured Data
Visualize relationships with interactive graph charts with the first Power BI custom visual that’s designed for graph-structured data!
The visual will use data within the Source Nodes, Target Nodes and Value fields to create nodes, identify inter-node relationships and connect them with links.
Compared to the the category structure used by Drill Down Network PRO, this visual’s graph structure provides the report creator with more control over the node relationships, introduces new customization options for the entire graph or each individual node and even link, and supports DAX measures.

Was this helpful? Thank you for your feedback!
Sorry about that.
How can we improve it?