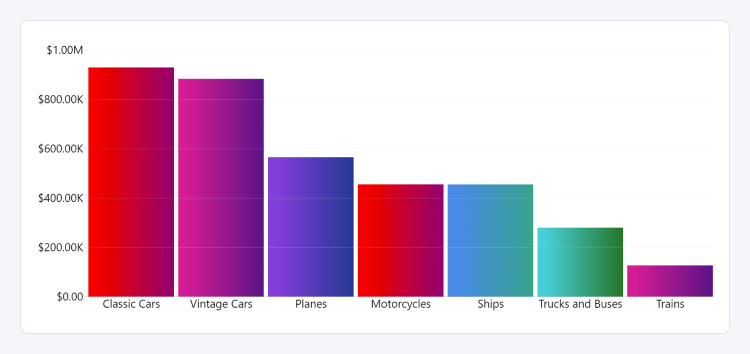
Gradient to a derived color
Choosing this setting as the Fill Mode will apply a linear gradient effect to each chart element, using its fill color (governed by Category Colors or the Fill Color of each series) as the start point and an automatically derived variation of the fill color as the end point. This fill mode is best used to provide a subtle sense of depth and increase the visual distinction between different chart elements.
Once selected, additional options will be revealed to further customize the gradient’s appearance:
- Gradient Direction
- Outer Opacity
- Gradient Start Location
- Lightness Adjustment
- Hue Adjustment
- Saturation Adjustment

Was this helpful? Thank you for your feedback!
Sorry about that.
How can we improve it?