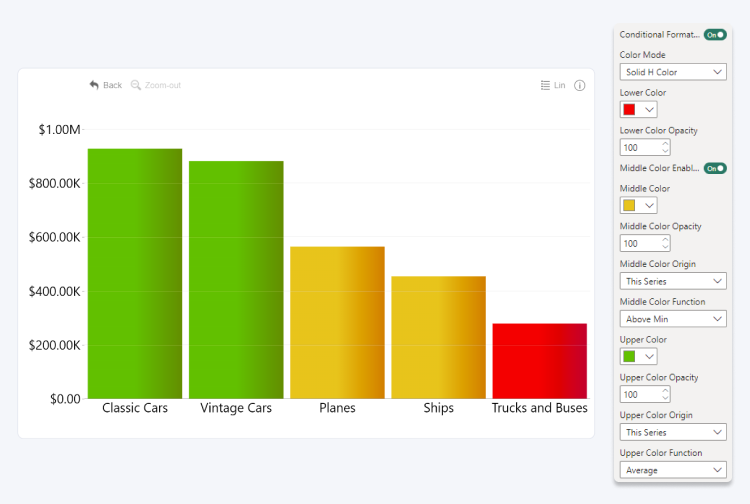
Conditional Formatting
Drill Down Combo PRO can automatically apply certain formatting rules based on your data. You can access this feature by enabling the Conditional Formatting toggle in Visualizations Pane -> Format Visual -> Series X Configuration.
You can either manually enter a constant value, or dynamically calculate it from the same or another series – percentage, average, above minimum or max. Furthermore, you can manually select specific color tones for different conditions, create gradients, or apply a stepped color palette depending on the values in each data point.
The most common way to use conditional formatting is by setting a constant value, and the visual will apply specific colors to each data point depending on whether they exceed or fall below that value (for example, green for values above your KPI and red for those that don’t meet it). However, this feature can also be adapted for a wide range of other use cases.

Was this helpful? Thank you for your feedback!
Sorry about that.
How can we improve it?