806
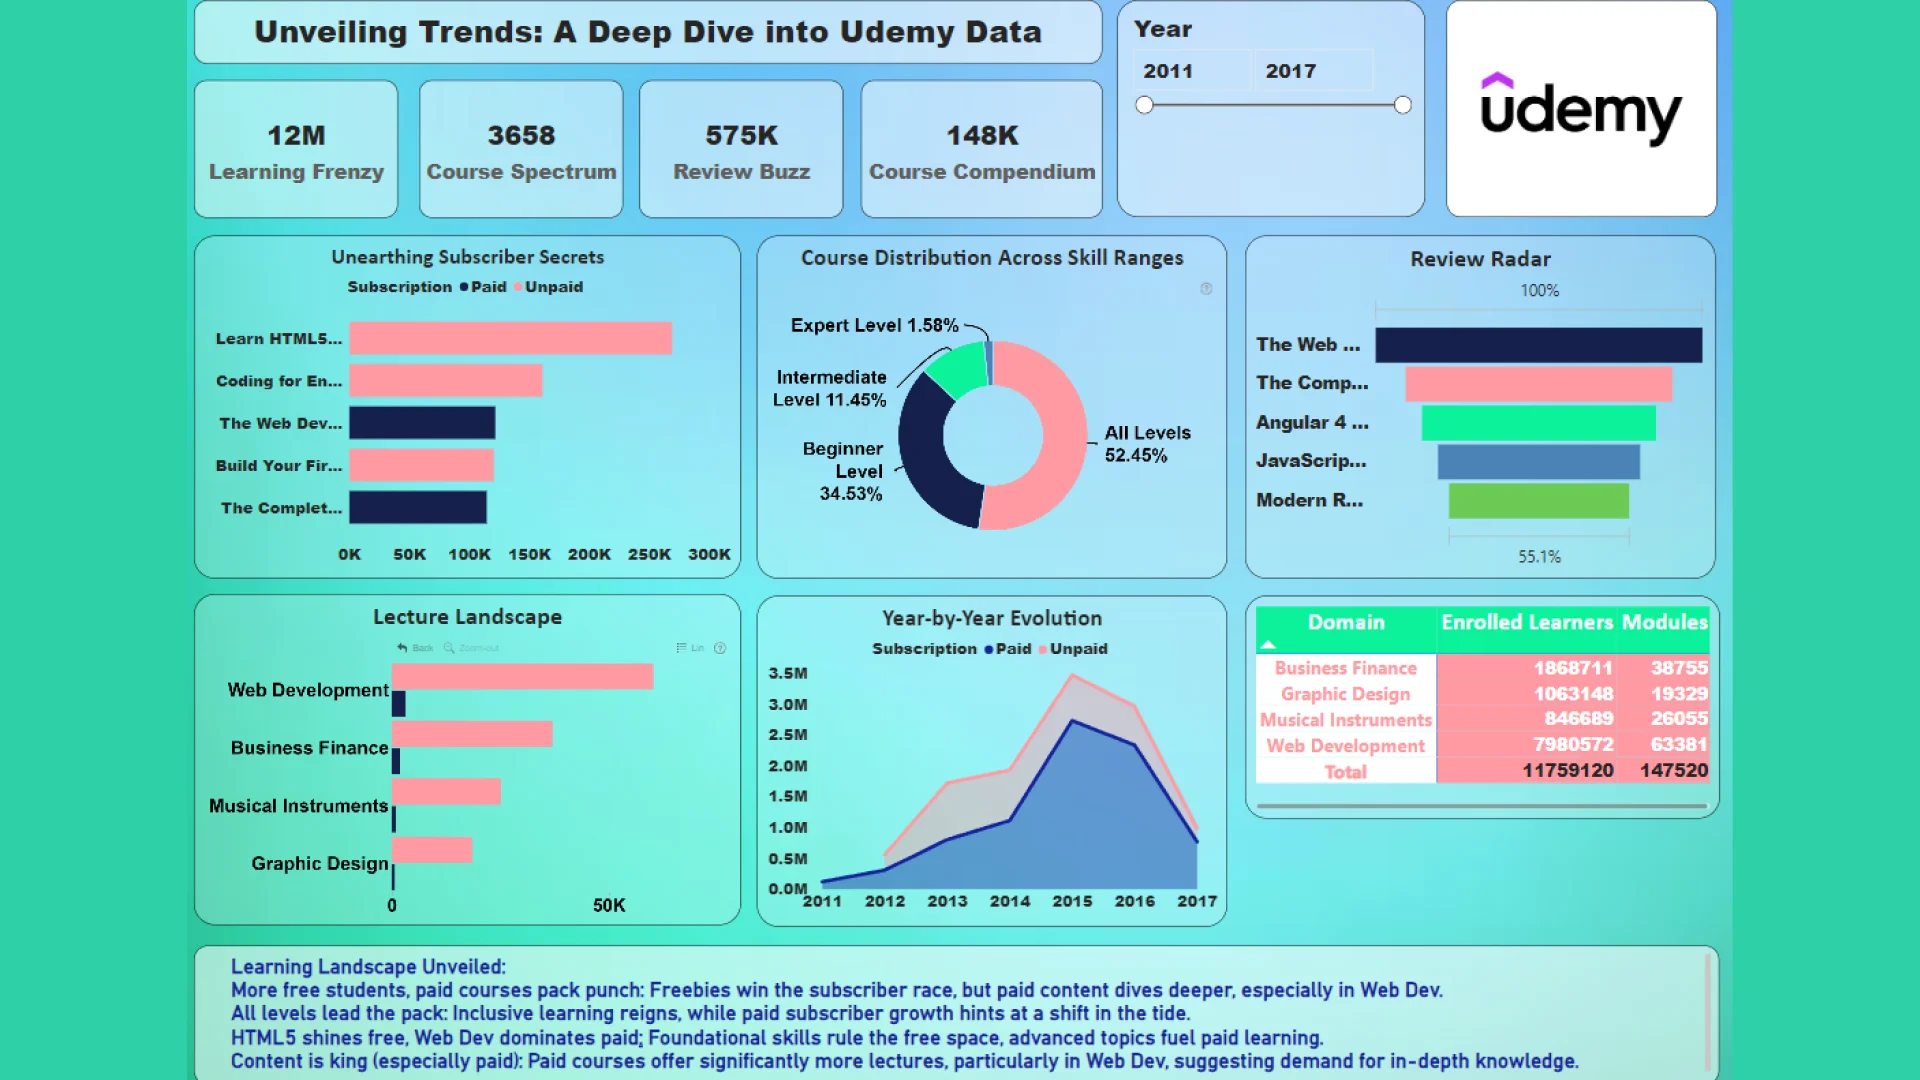
Unveiling Trends: A Deep Dive into Udemy Data
Unveiling Trends: A Deep Dive into Udemy Data
Report Author: Aditi Bhargava
806
Share template with others
Report submitted for Onyx Data DataDNA ZoomCharts Mini Challenge, January 2024. The report was built based on Udemy Courses dataset and includes ZoomCharts custom Drill Down PRO visuals for Power BI.
Author's description:
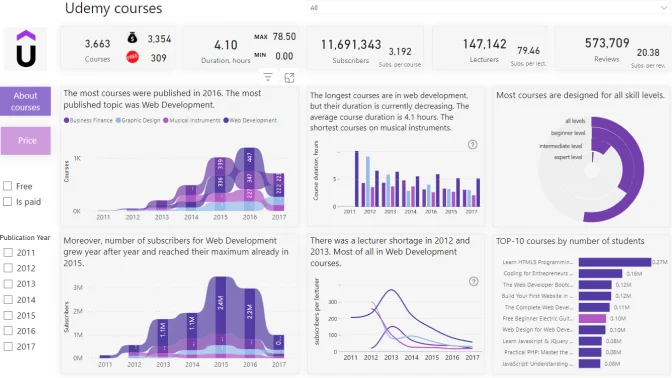
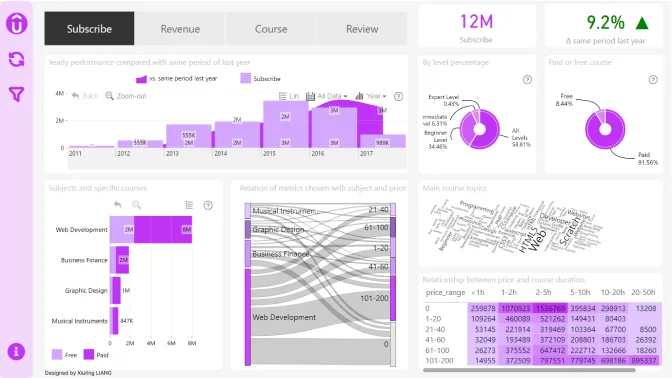
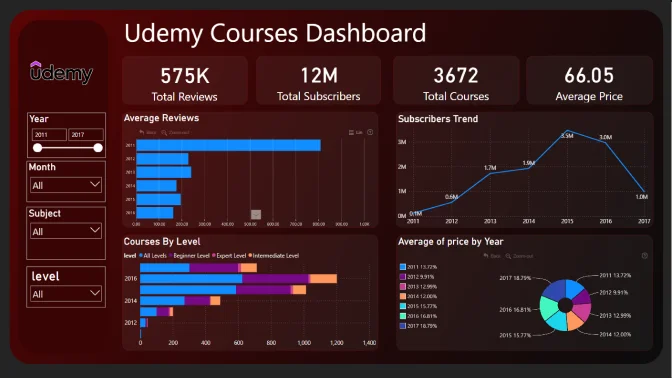
Uncover Course Insights and Trends: Dive into a comprehensive dataset covering 520 Udemy courses, capturing diverse aspects like course titles, paid/free status, subscriber numbers, reviews, lecture count, levels, duration, publication dates, and subject categories. Explore learner preferences, content strategies, and evolving dynamics to guide course development and marketing efforts.
4U Report Challenges
Participate in data challenges, build and submit reports to get free template downloads.
Join CommunityMobile view allows you to interact with the report. To Download the template please switch to desktop view.
Was this helpful? Thank you for your feedback!
Sorry about that.
How can we improve it?