657
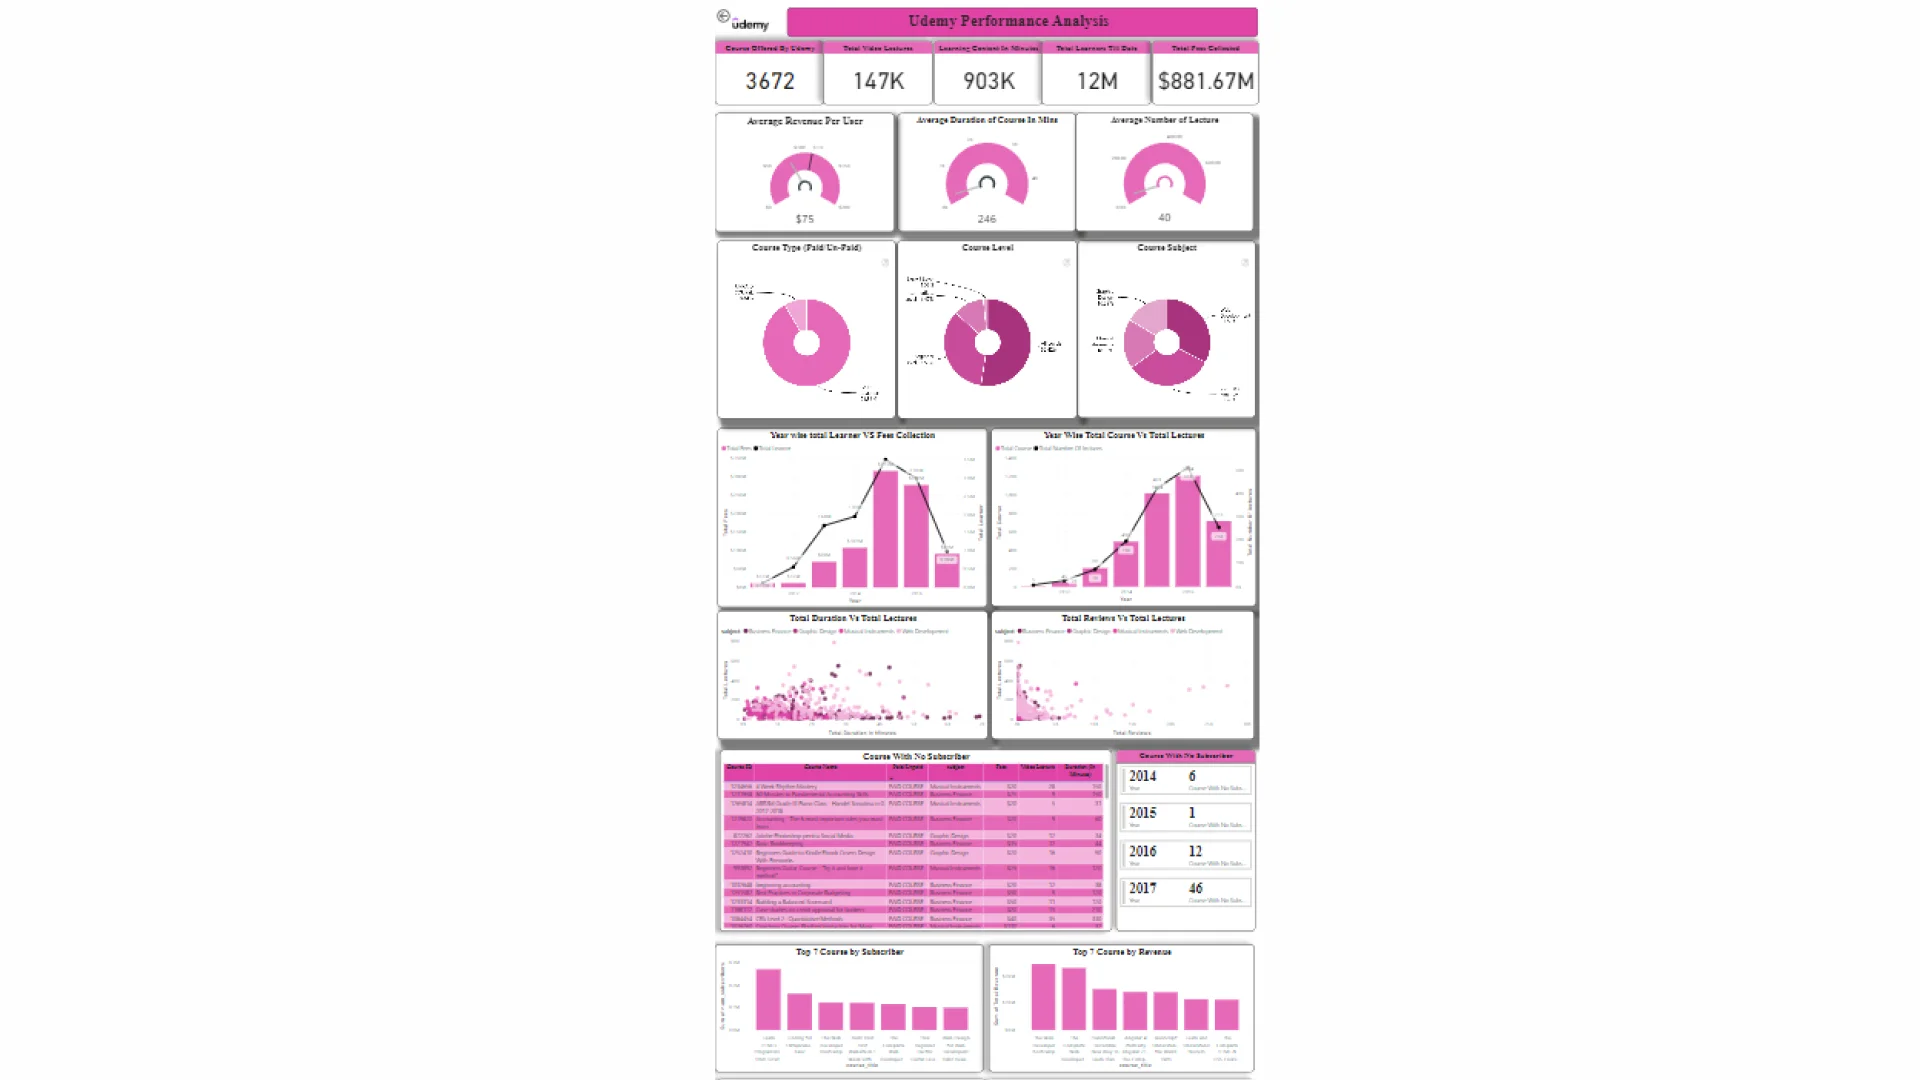
Udemy Performance Analysis
Udemy Performance Analysis
Report Author: Yash Sheth
657
Share template with others
Report submitted for Onyx Data DataDNA ZoomCharts Mini Challenge, January 2024. The report was built based on Udemy Courses dataset and includes ZoomCharts custom Drill Down PRO visuals for Power BI.
Author's description:
1. The Average Revenue Per User (ARPU) for the platform is $75.
2. The year 2015 stands out with the highest revenue and the largest number of learners on the platform.
3. There are a total of 65 courses with zero subscribers, and notably, 46 of them were launched in 2017.
4. Expert-level courses have a high fee, potentially explaining the lower enrollment. The ARPU for Expert Level Courses is $108.
5. Approximately 33.33% of users opt for unpaid courses, suggesting that satisfaction might drive more subscriptions on the platform.
6. Web Development contributes significantly, making up 71% of total revenue and accounting for 32.65% of all learners.
7. Business Finance is the dominant domain for Expert Level courses, comprising 53.5% of subscriptions in this category.
8. A notable 34.5% of learners start their learning journey at the basics level
4U Report Challenges
Participate in data challenges, build and submit reports to get free template downloads.
Join CommunityMobile view allows you to interact with the report. To Download the template please switch to desktop view.
Was this helpful? Thank you for your feedback!
Sorry about that.
How can we improve it?