776
Udemy Courses Analysis 6
Udemy Courses Analysis 6
Report Author: Shivani Mittal
776
Share template with others
Report submitted for Onyx Data DataDNA ZoomCharts Mini Challenge, January 2024. The report was built based on Udemy Courses dataset and includes ZoomCharts custom Drill Down PRO visuals for Power BI.
Author's description:
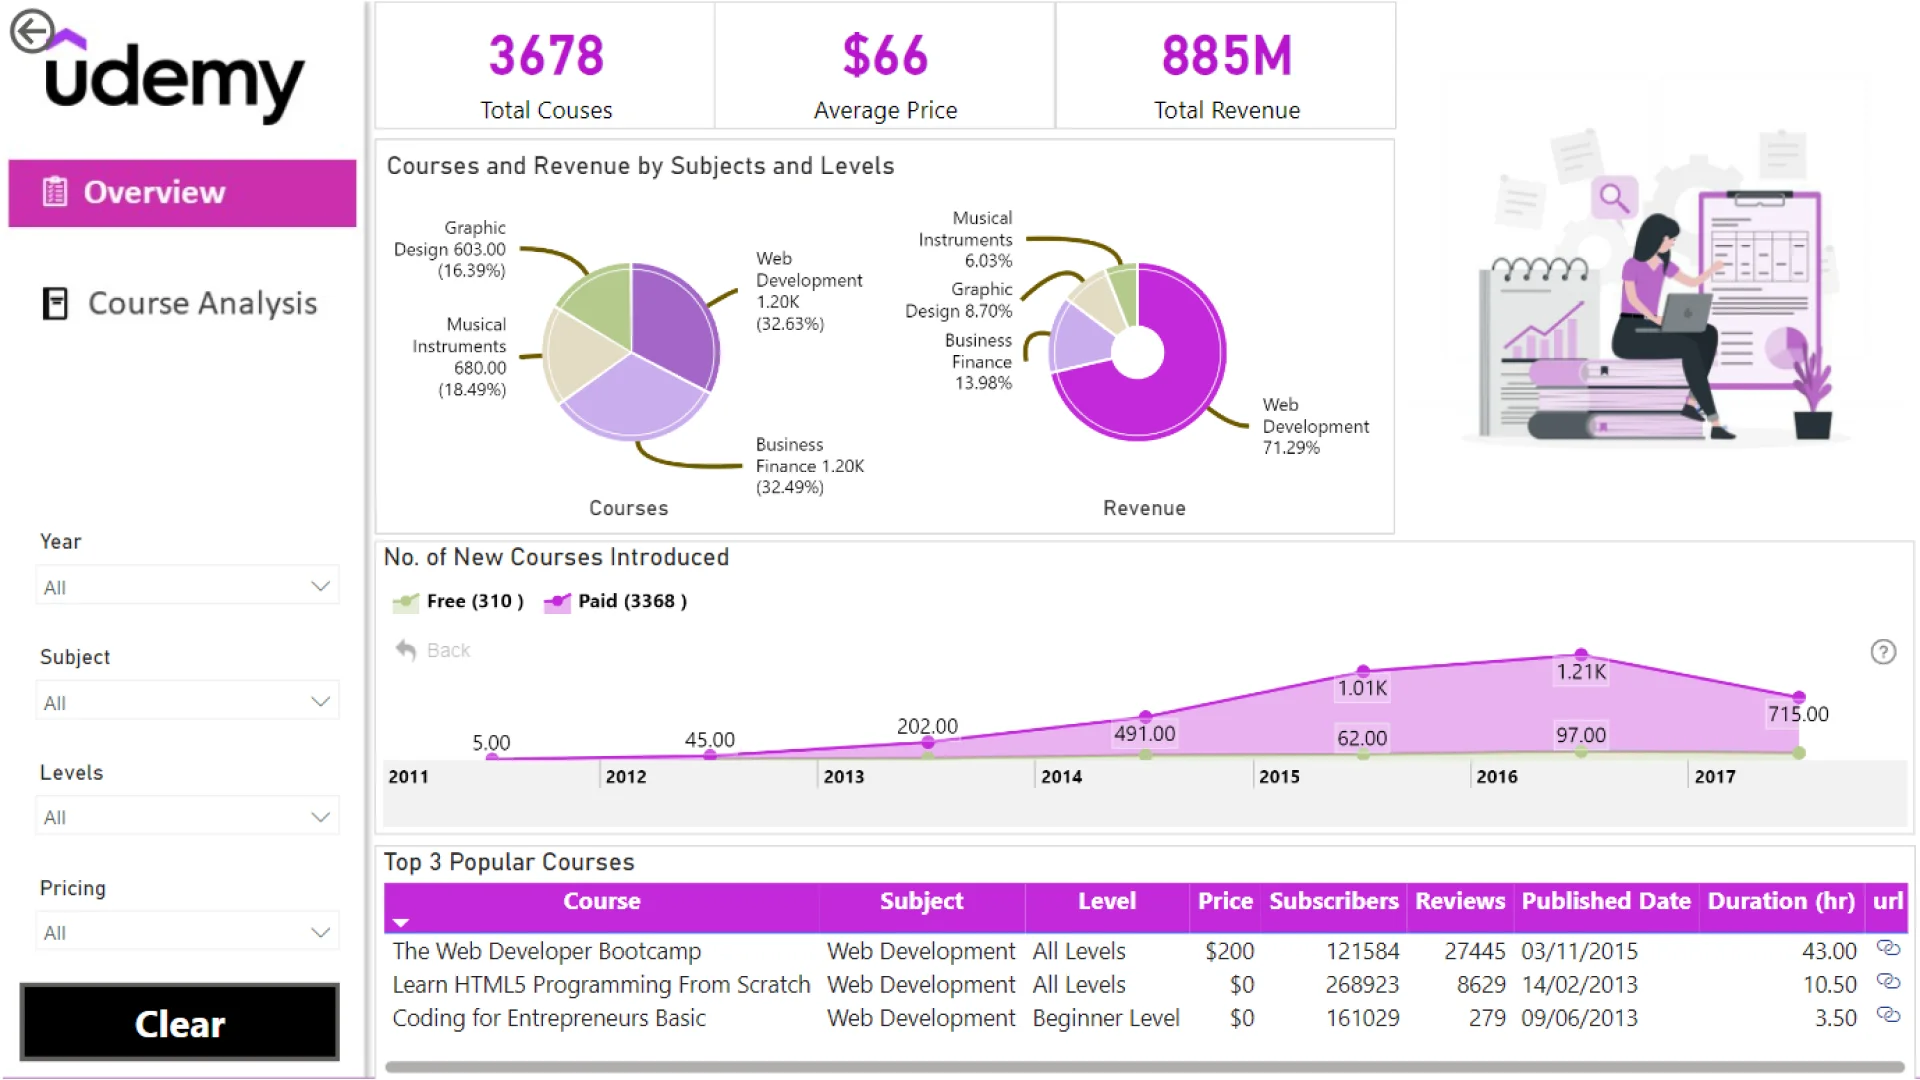
The advanced Power BI dashboard comprises two pages designed to provide a comprehensive overview and detailed insights into an extensive dataset of online courses. The first page offers a holistic view with key metrics, visualizations such as donut charts and bar graphs showcasing course distribution by level, and a dynamic timeline illustrating the growth in course publications. Filters enable users to refine data by level, subject, and pricing.
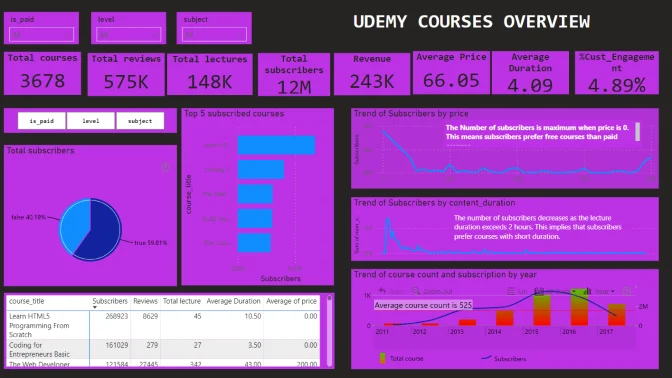
The second page delves into individual course details, featuring a data matrix with essential information, complemented by visuals like bubble charts and cards for deeper analysis. KPIs such as average rating and content duration are highlighted, while slicers and drill-through functionality enhance user interactivity, allowing seamless exploration of the dataset for a more informed perspective. The dashboard is not only aesthetically pleasing but also serves as a powerful tool for data-driven decision-making in the competitive landscape of online education.
4U Report Challenges
Participate in data challenges, build and submit reports to get free template downloads.
Join CommunityMobile view allows you to interact with the report. To Download the template please switch to desktop view.
Was this helpful? Thank you for your feedback!
Sorry about that.
How can we improve it?