665
Udemy Courses Analysis 10
Udemy Courses Analysis 10
Report Author: Rohit Abraham Francis Giles
665
Share template with others
Report submitted for Onyx Data DataDNA ZoomCharts Mini Challenge, January 2024. The report was built based on Udemy Courses dataset and includes ZoomCharts custom Drill Down PRO visuals for Power BI.
Author's description:
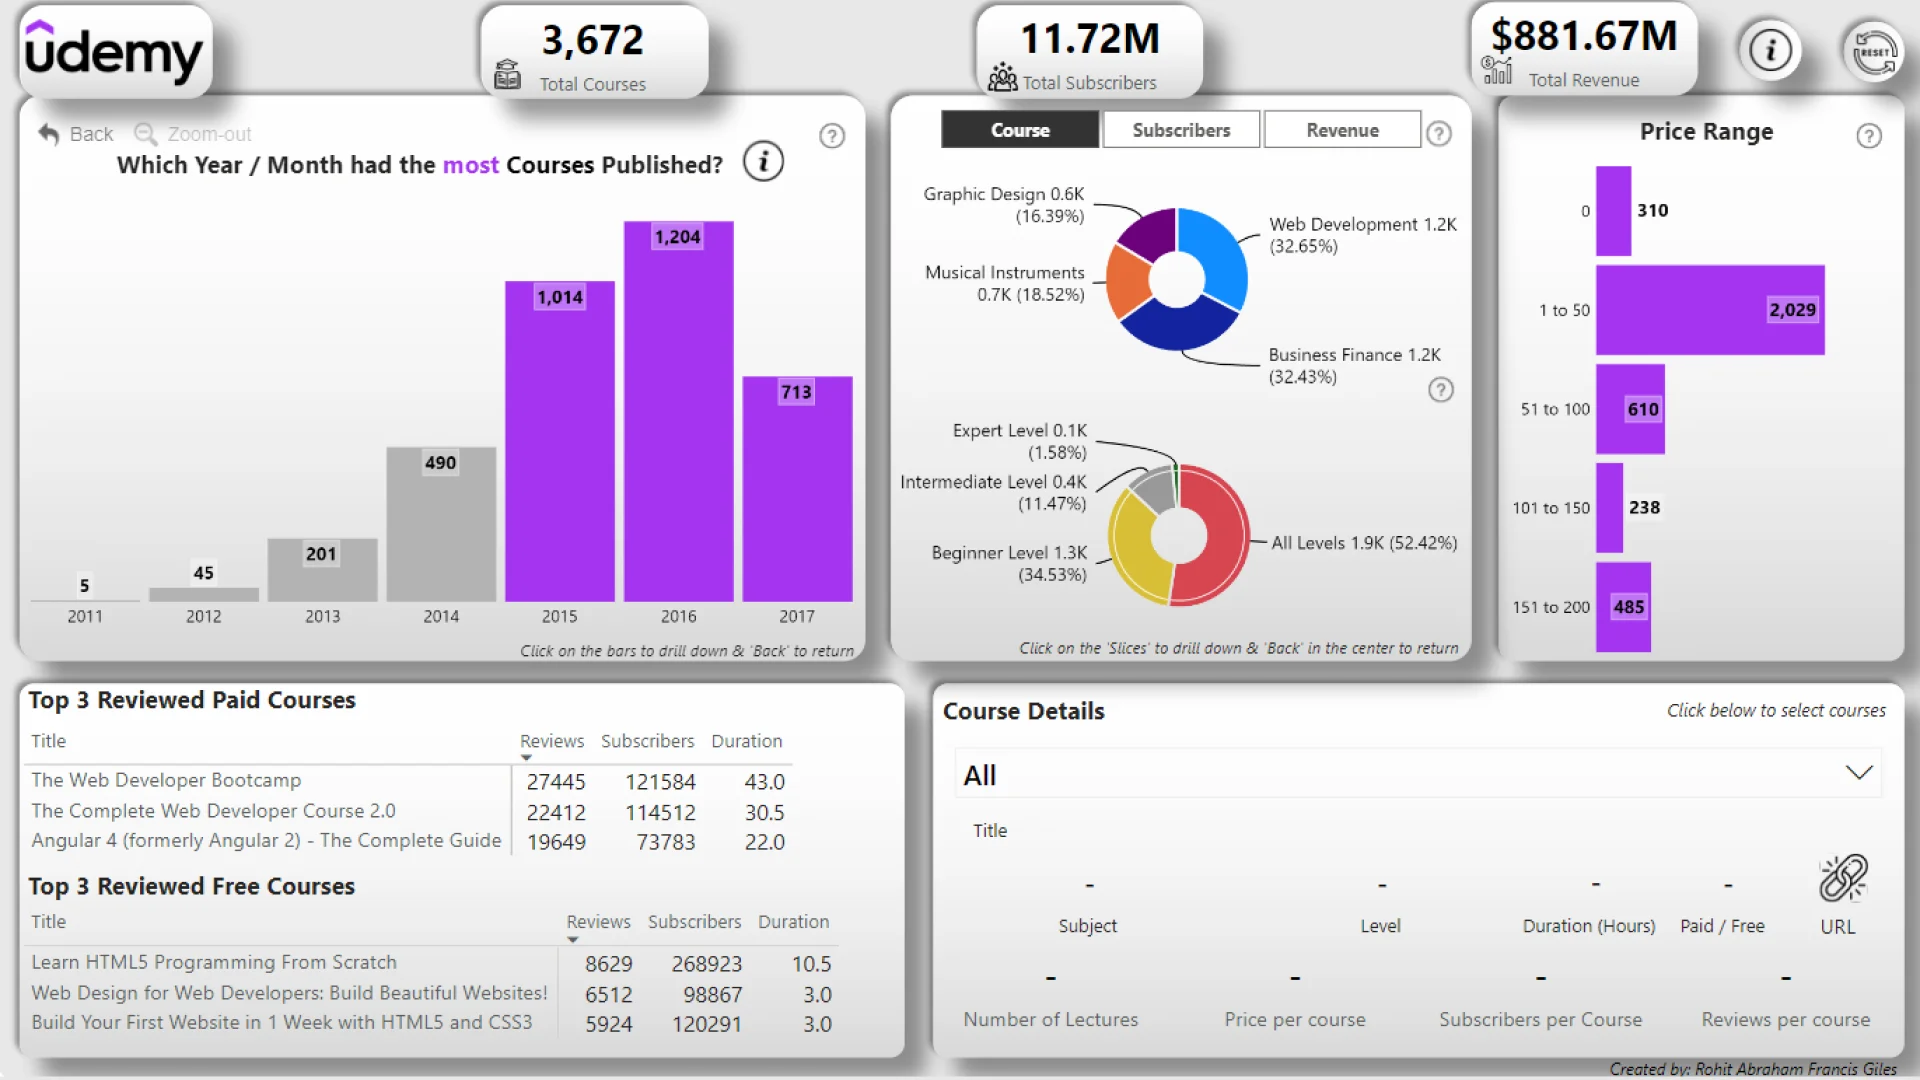
This report shows the Cumulative number of Subscription, Courses & Revenue over 7 years. The donut chart below shows the Subject, Level & Type wise drill down on the number of courses over the years. Slicer to toggle between Course, Subscribers & Revenue is provided for the donut chart. Price Range shows the distribution of courses in each price range. Hover over the bars and slices to view further details. The Course details tab lets you get information on individual courses.
4U Report Challenges
Participate in data challenges, build and submit reports to get free template downloads.
Join CommunityMobile view allows you to interact with the report. To Download the template please switch to desktop view.
Was this helpful? Thank you for your feedback!
Sorry about that.
How can we improve it?