1750
Top 1000 Youtubers Analysis
Top 1000 Youtubers Analysis

More Report pages
Report Author: Sushree Jena
1750
Share template with others
Report submitted for Onyx Data DataDNA ZoomCharts Mini Challenge, November 2023. The report was built based on Top YouTubers dataset and includes ZoomCharts custom Drill Down PRO visuals for Power BI.
Author's description:
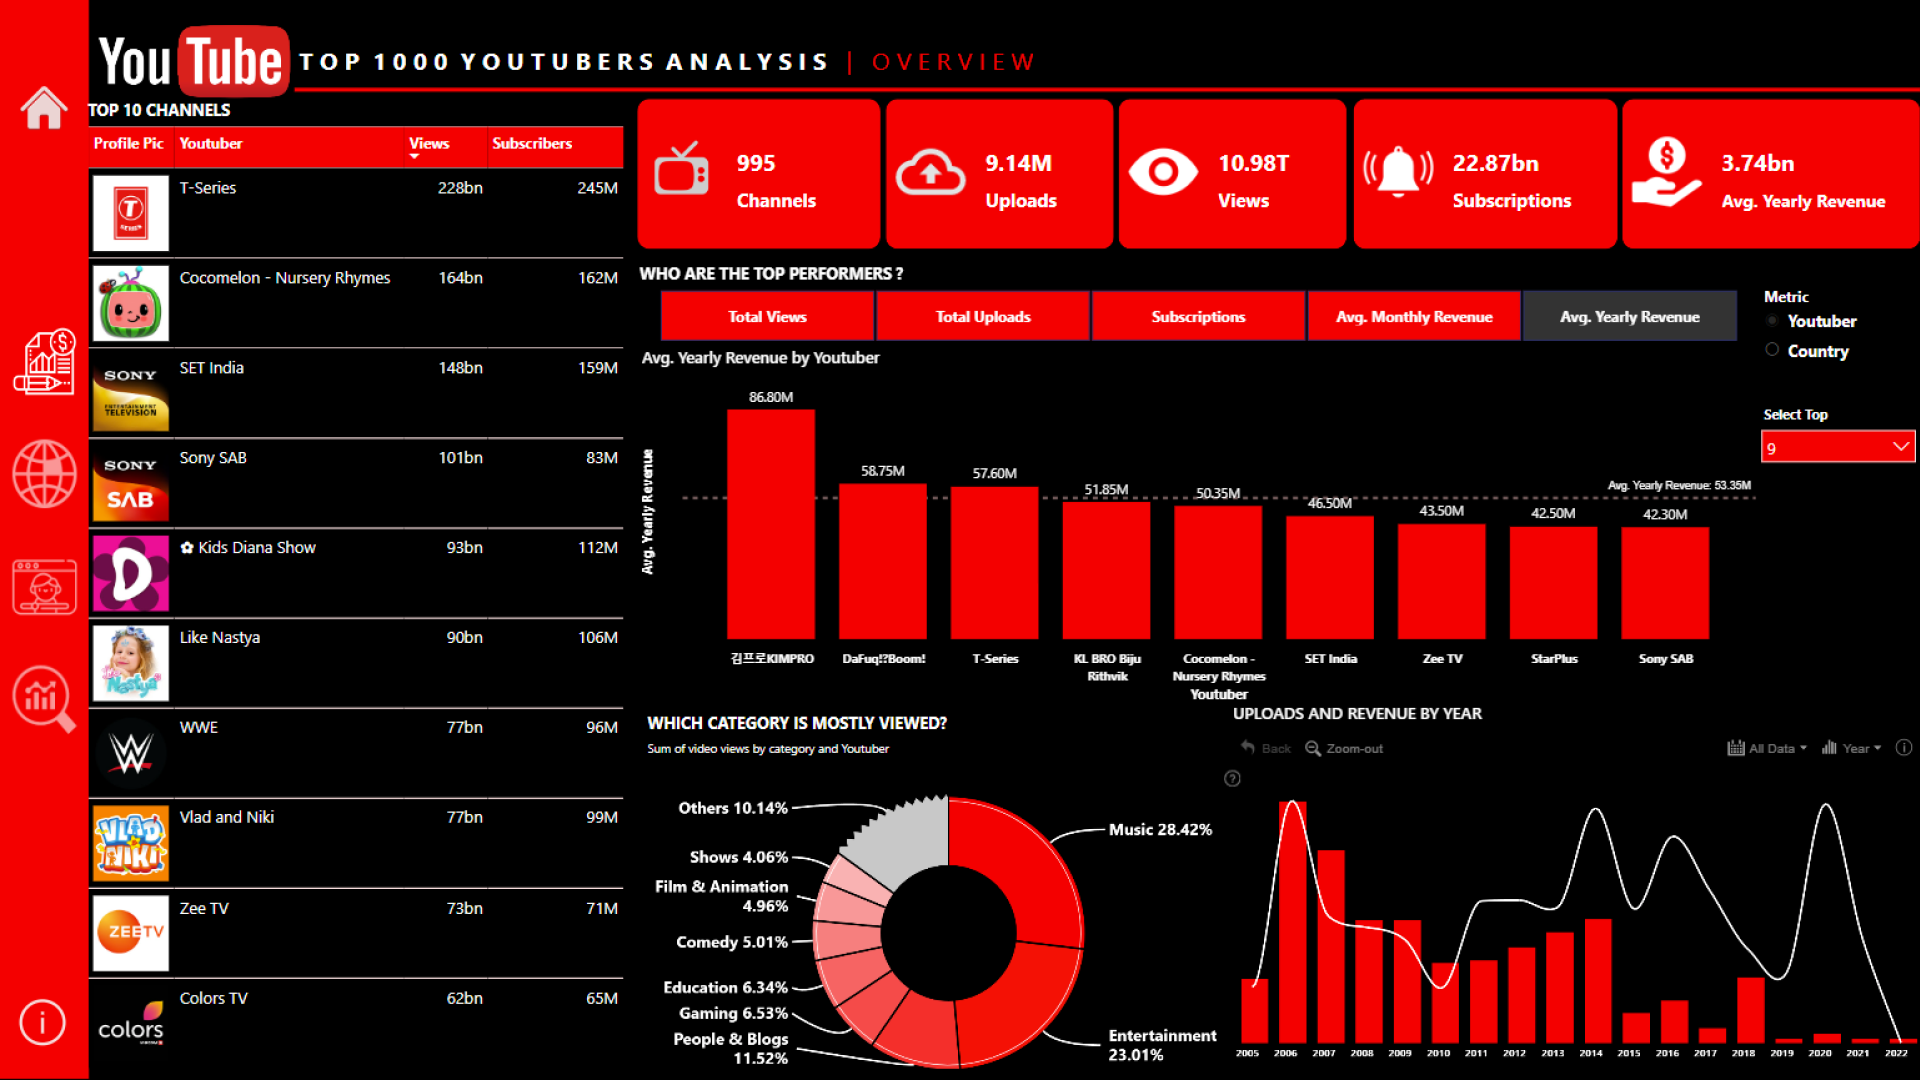
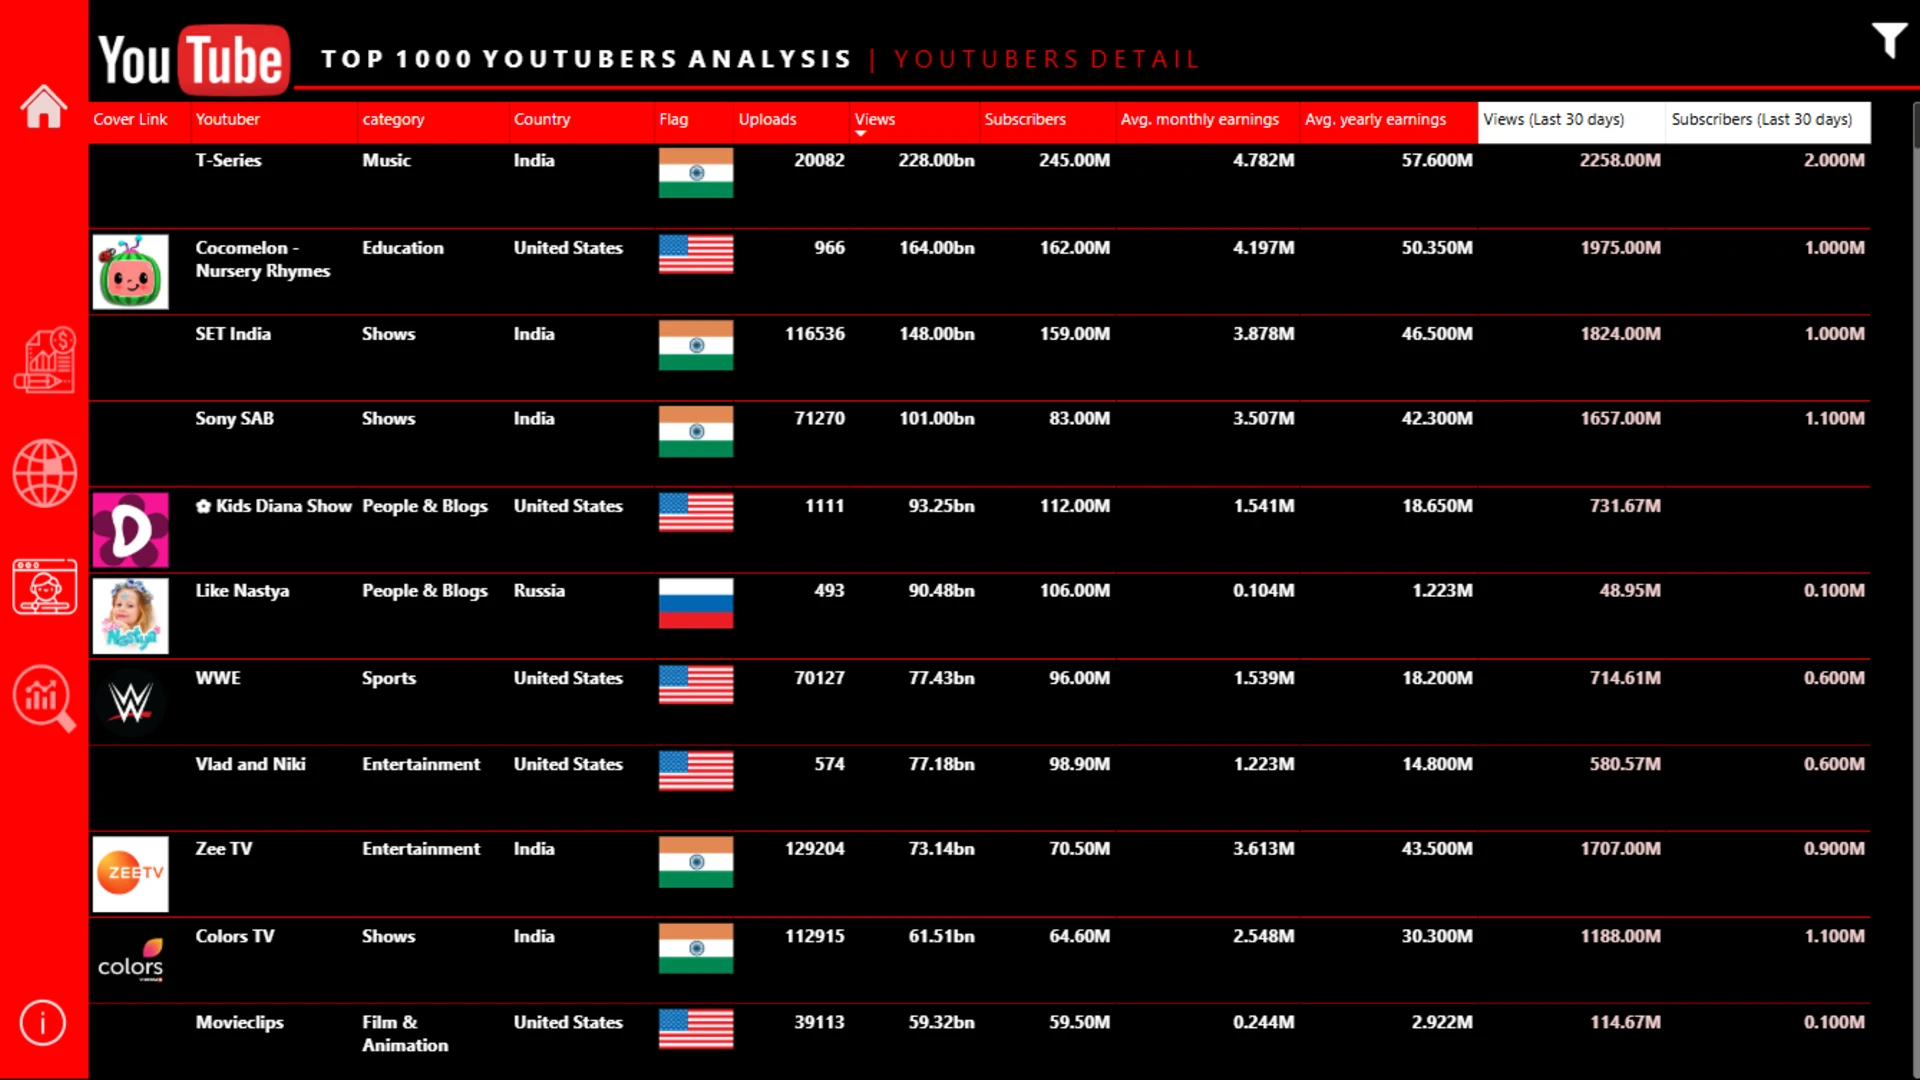
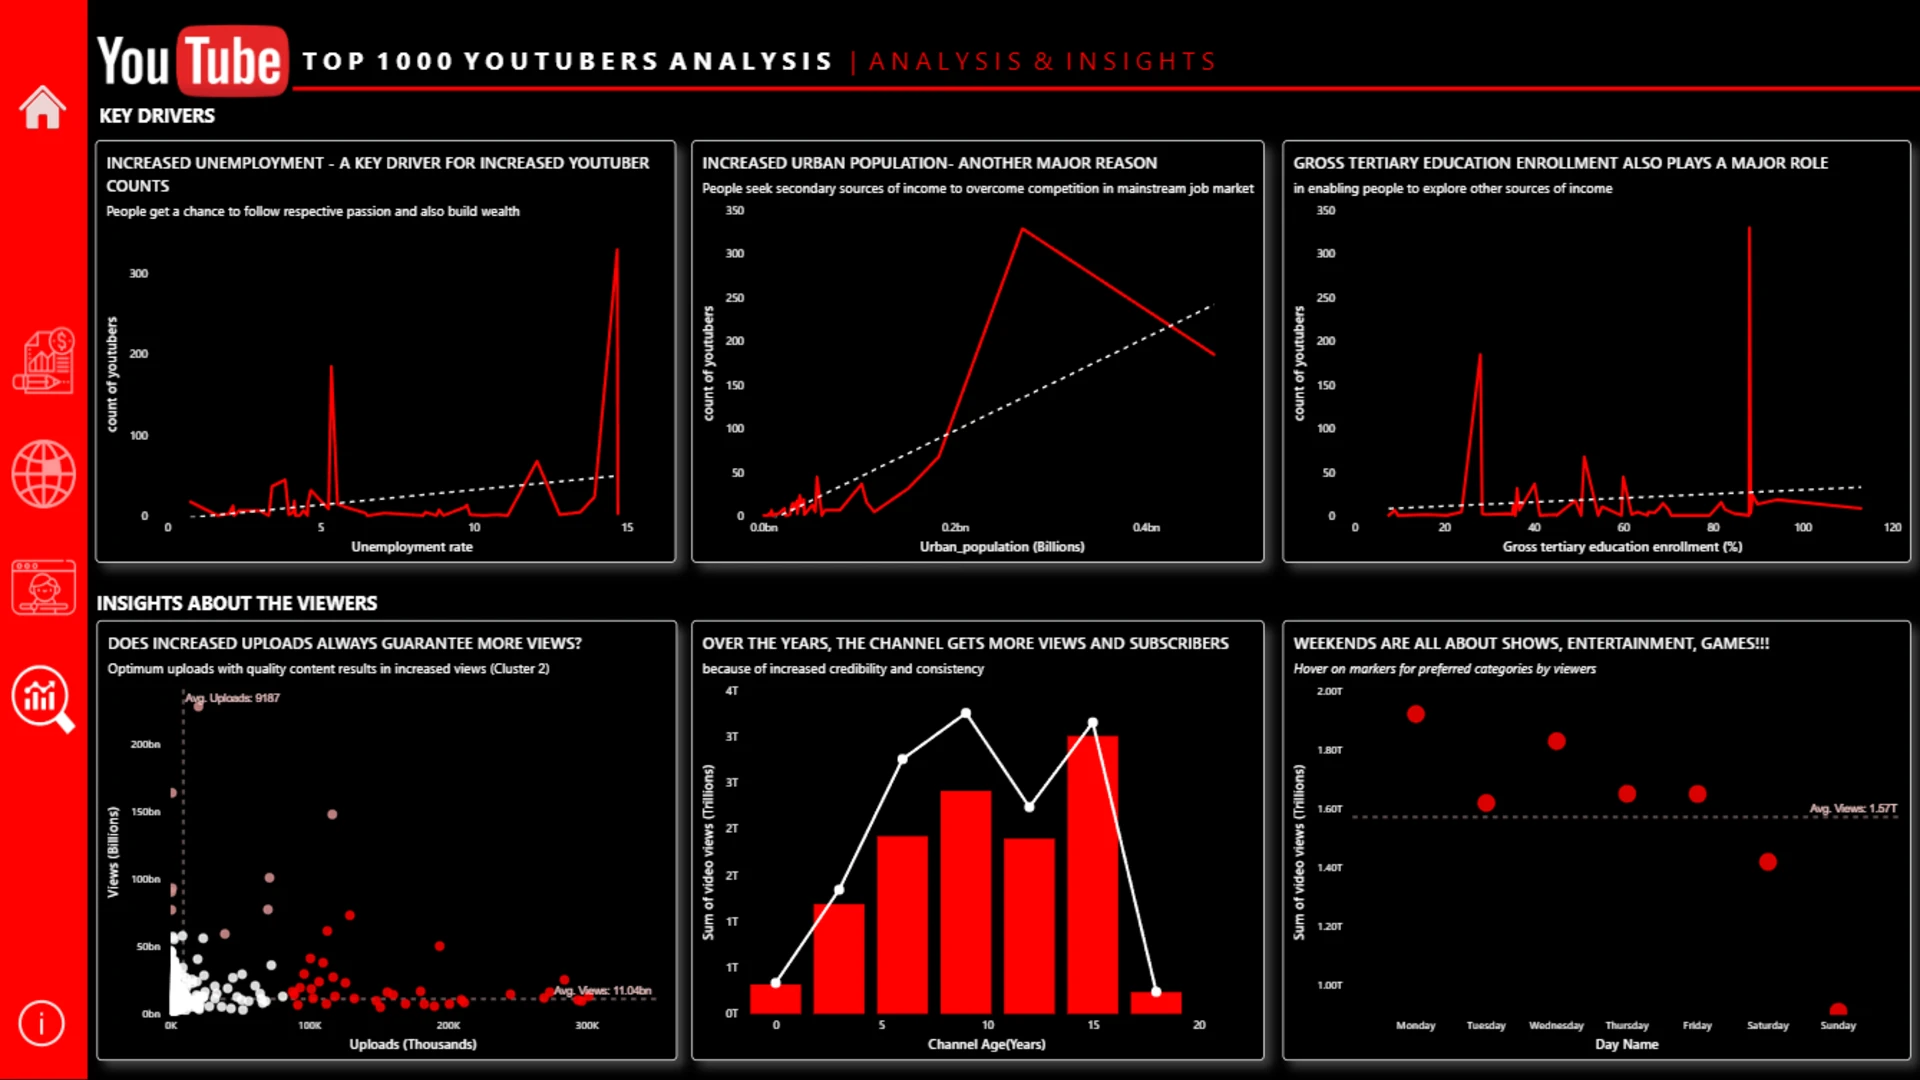
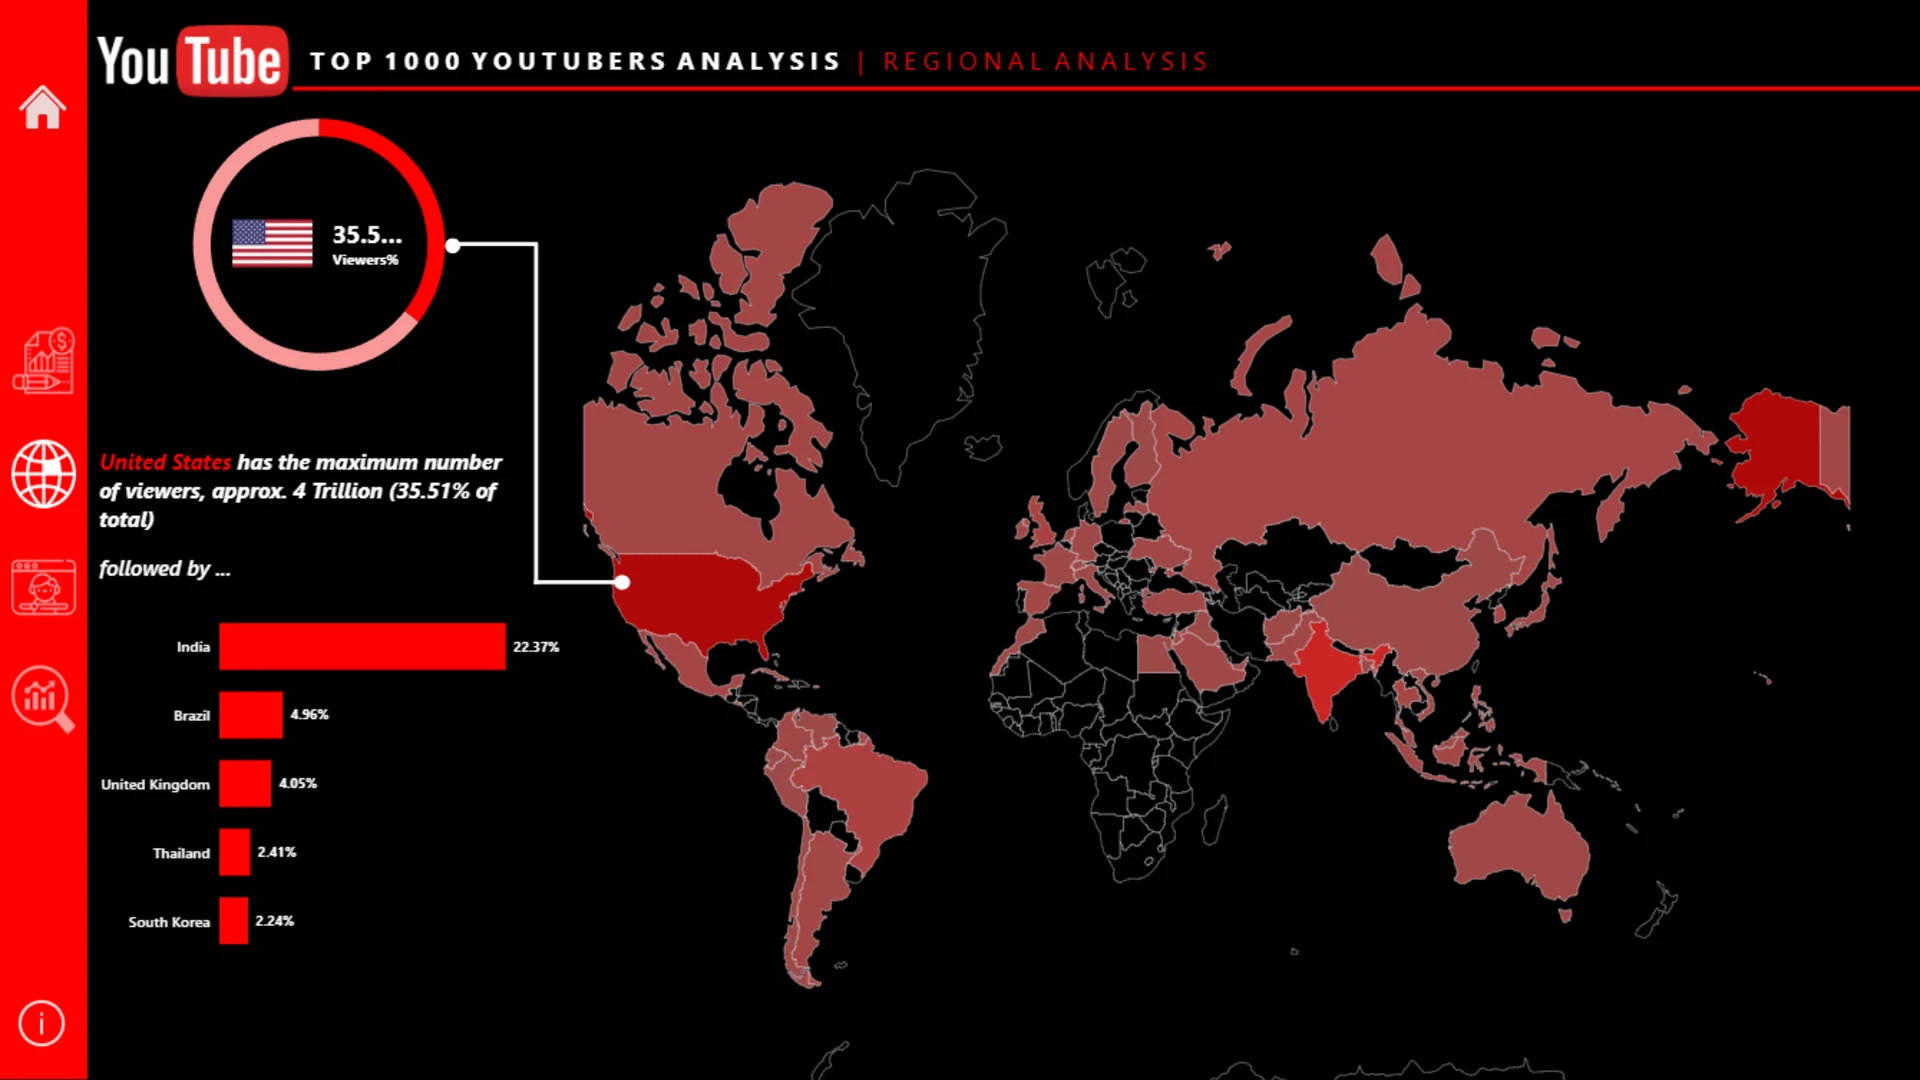
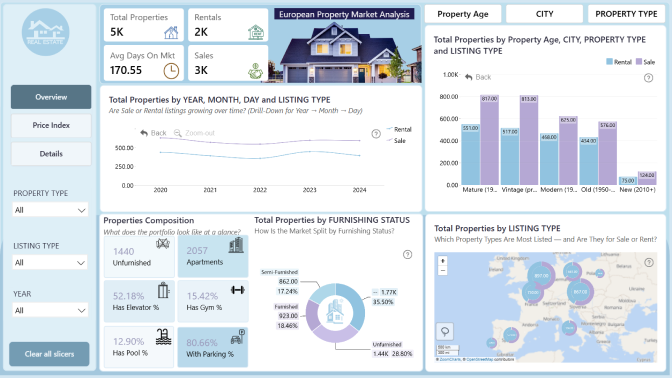
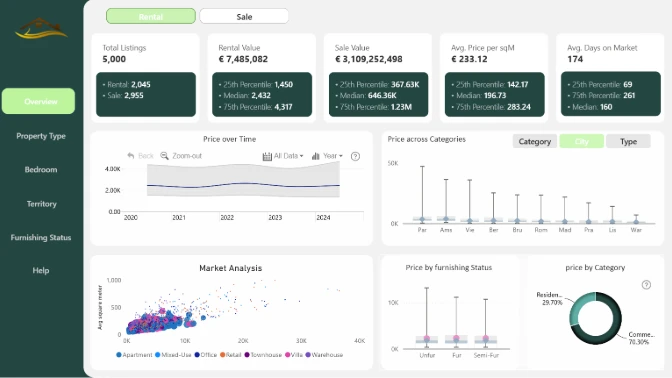
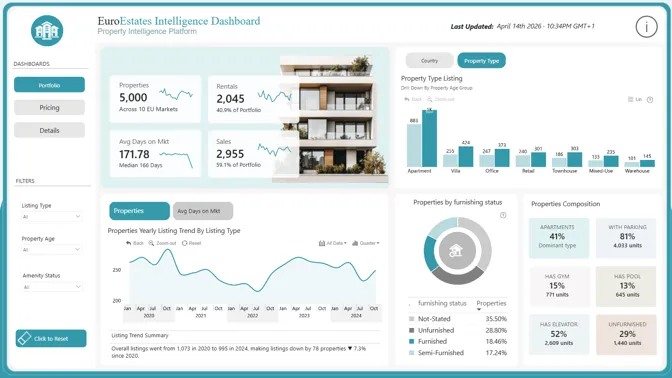
I have categorised the analysis into overview, regional analysis, YouTubers detail and insights page for details. As the name suggests, overview gives an overall idea, who are the top performers, trends of upload and revenue, KPIs like total uploads, subscribers, etc. Regional analysis gives more details based on Country. I have included insights page to show which can be the key drivers for increase in YouTuber counts over years and have also included some insights about our viewers.
4U Report Challenges
Participate in data challenges, build and submit reports to get free template downloads.
Join CommunityMobile view allows you to interact with the report. To Download the template please switch to desktop view.
Was this helpful? Thank you for your feedback!
Sorry about that.
How can we improve it?