881
Supply Chain Data Set Challenge
Supply Chain Data Set Challenge
Report Author: Phyo Sett Lin
881
Share template with others
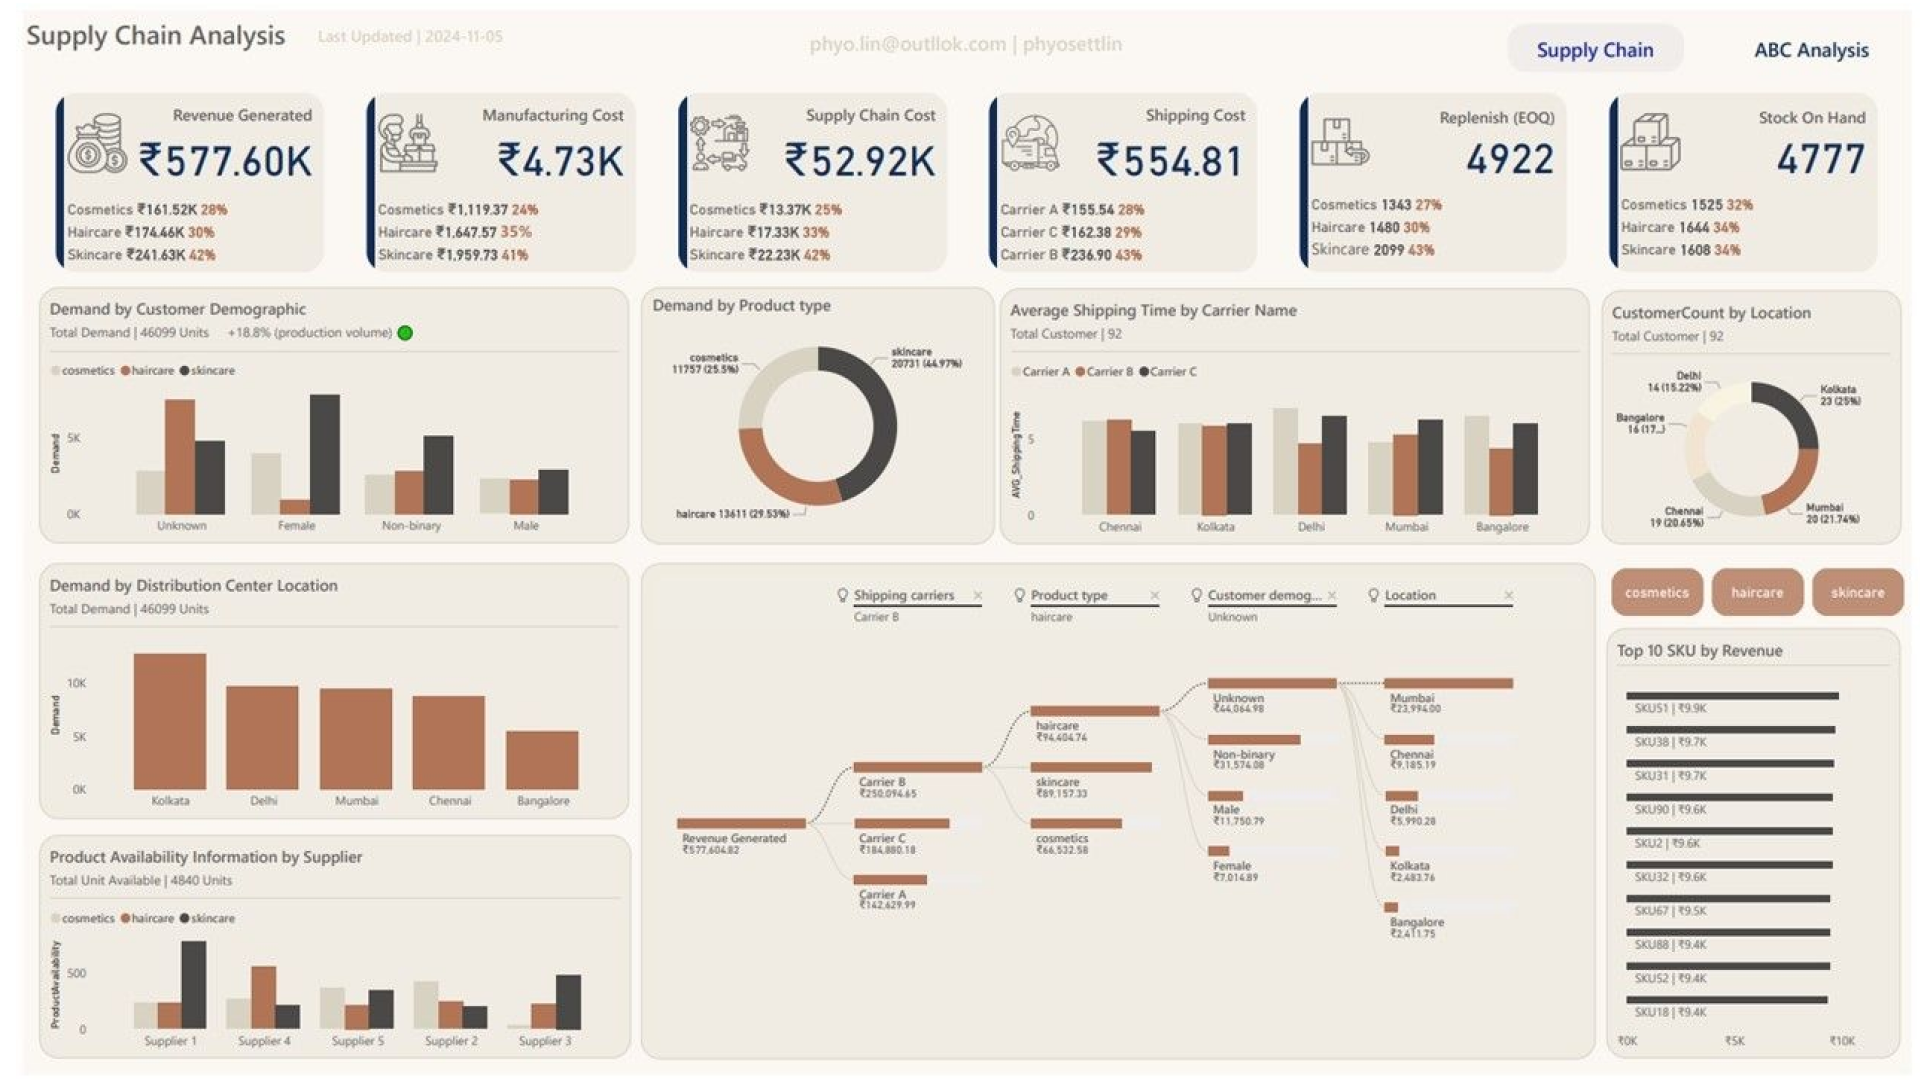
Report submitted for Onyx Data DataDNA ZoomCharts Mini Challenge, November 2024. The report is based on the Supply Chain Analysis dataset and includes ZoomCharts custom Drill Down PRO visuals for Power BI.
Author's description:
My dashboard is designed with two main sections to provide a comprehensive overview of key logistics metrics and strategic inventory insights. The first section serves as a landing page, summarizing critical aspects of the logistics cycle, including revenue, stock levels, customer metrics, and transportation details.
The second, more in-depth section focuses on stock analysis through revenue-based categorization. Using the Pareto principle (80/20 rule), I have segmented SKUs into three categories: A, B, and C. This segmentation is intended to prioritize inventory management and support more efficient decision-making.
4U Report Challenges
Participate in data challenges, build and submit reports to get free template downloads.
Join CommunityMobile view allows you to interact with the report. To Download the template please switch to desktop view.
Was this helpful? Thank you for your feedback!
Sorry about that.
How can we improve it?