755
Student Performance Power BI Report 5
Student Performance Power BI Report 5
More Report pages
Report Author: Olukayode Akintola-Peters
755
Share template with others
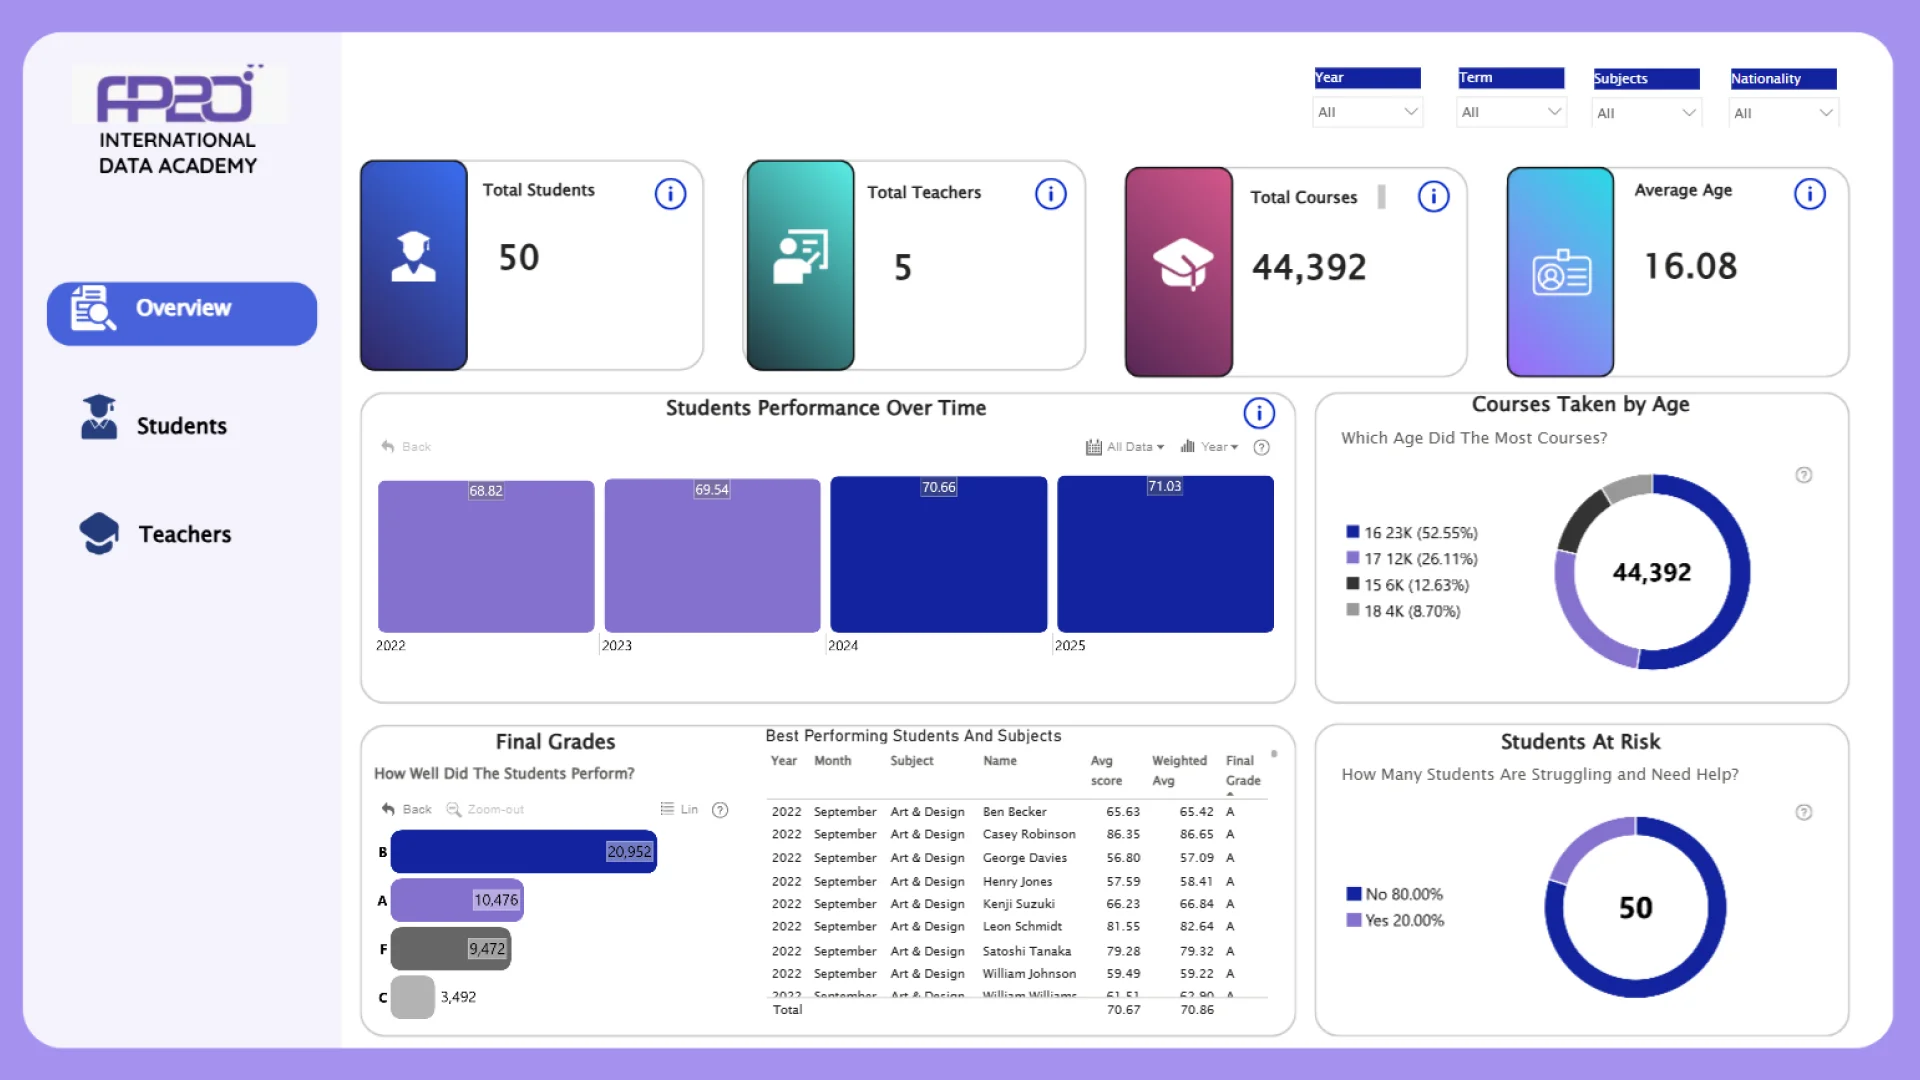
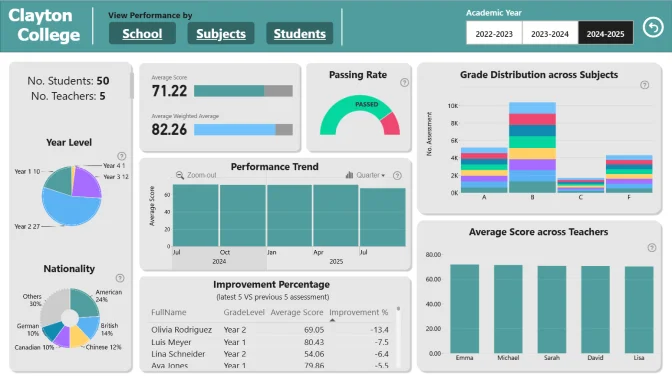
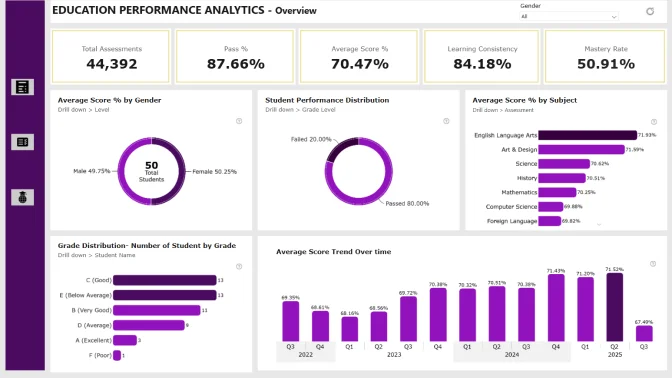
This Power BI report uses the Education/Student Performance dataset and features ZoomCharts Drill Down PRO custom visuals for Power BI. It was submitted to the FP20 Analytics ZoomCharts Data Challenge 31 in October 2025.
Author Description:
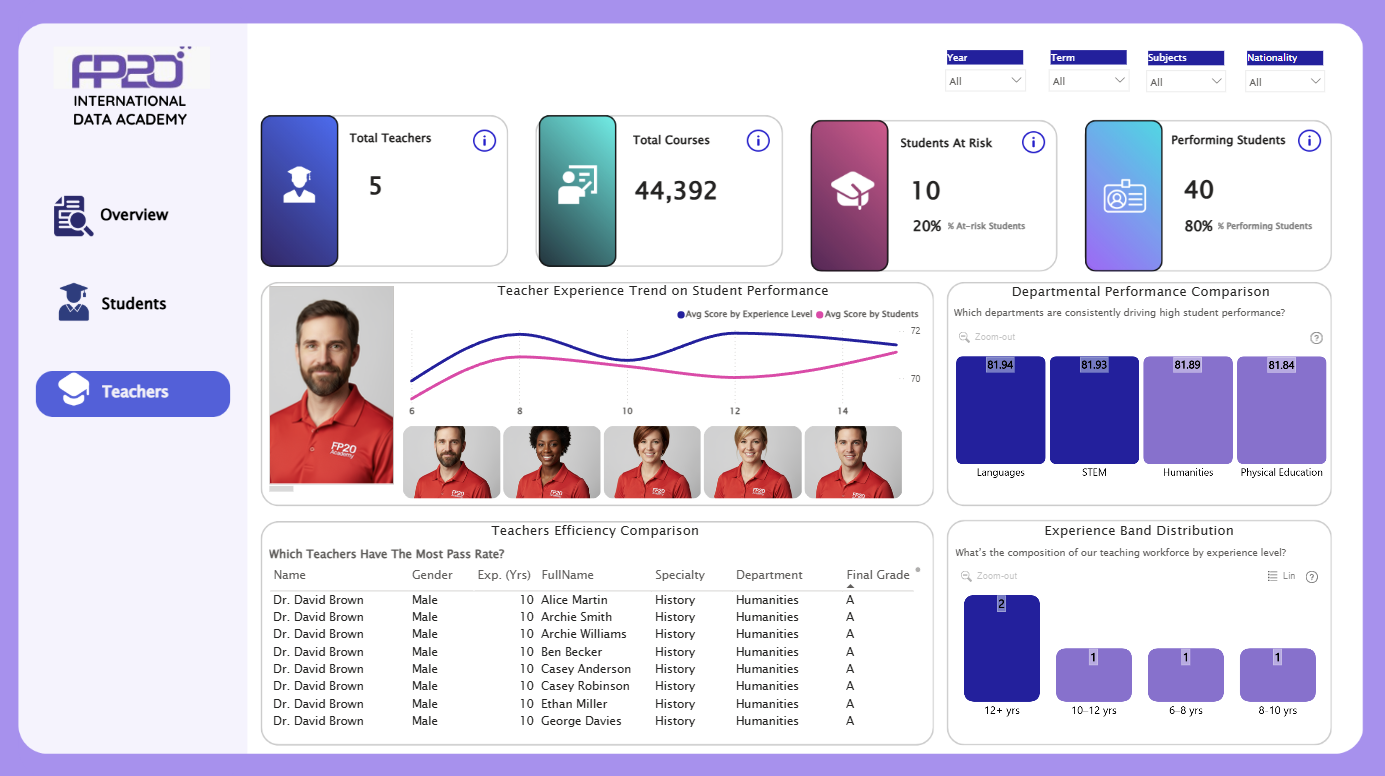
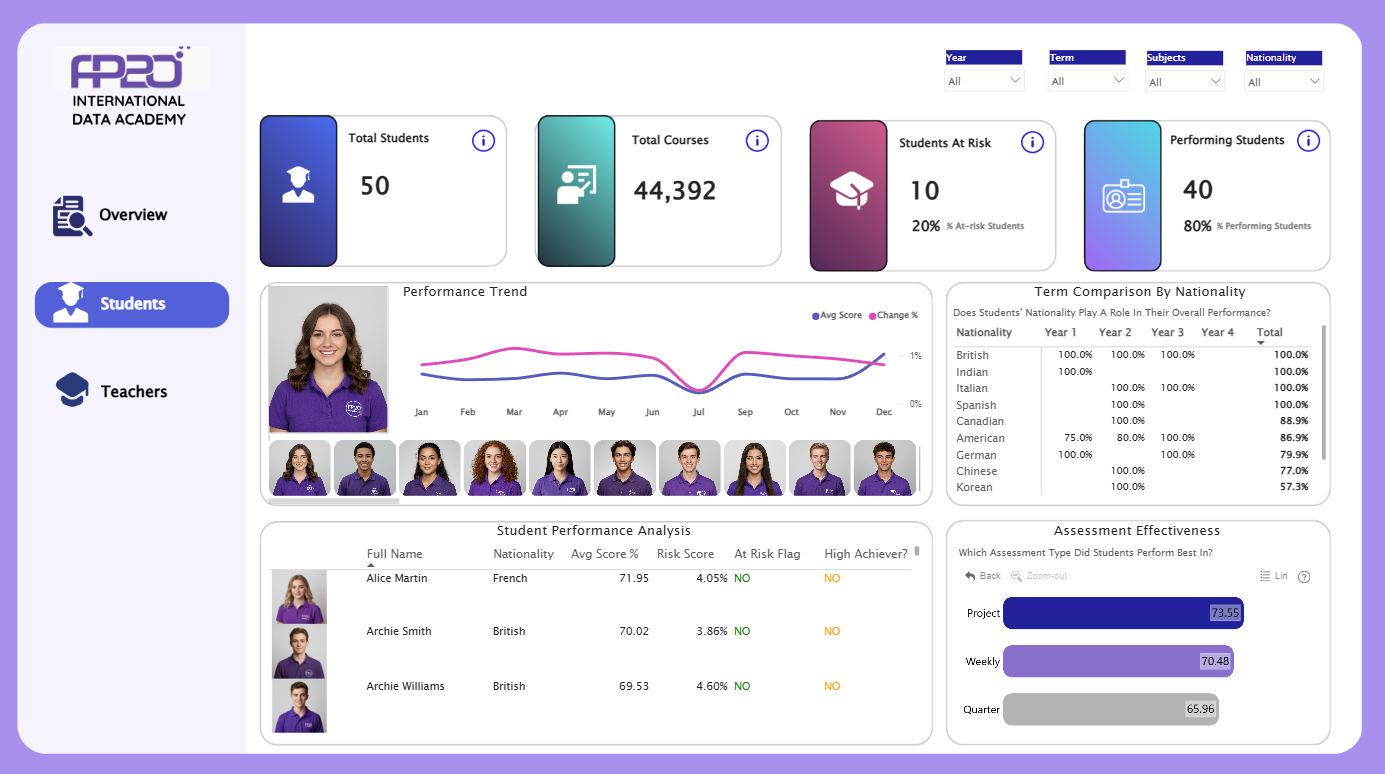
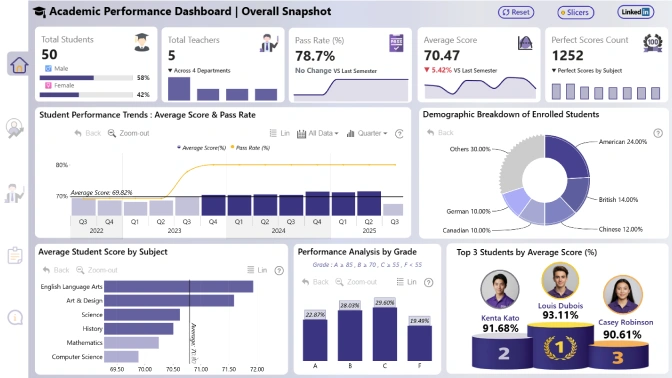
My latest data analysis provides an in-depth look into how teaching experience, workload, and departmental factors are shaping student performance at the Academy. Using comprehensive student and teacher performance data, I uncovered several trends that point the way toward smarter decisions in staff development, course design, and academic resource planning.
ZoomCharts visuals used
4U Report Challenges
Participate in data challenges, build and submit reports to get free template downloads.
Join CommunityMobile view allows you to interact with the report. To Download the template please switch to desktop view.
Was this helpful? Thank you for your feedback!
Sorry about that.
How can we improve it?