logo
For Power BI
  • Products
    • Custom Visuals for Power BI
    • Report Templates
  • Resources

      Resources

    • Documentation
    • Report Examples
    • Blog
    • Webinars
    • Video Tutorials
    • Visuals Gallery

    Support

    • ZoomCharts Assistance
    • Contact Sales
    • Contact Support
    • FAQ

    Challenges

    Challenges

    Improve your report creation skills by participating in free challenges for report creators.

    Learn more
    Get Developer License
  • Services
    • Power BI Report Development
    • Custom Visual Development
  • Challenges
  • Pricing
Get started
Get started
Get it now
Go back

Contents

Dashboard and report examples Real Estate Investment Insights Dashboard 8

156

Real Estate Investment Insights Dashboard 8

Real Estate Investment Insights Dashboard 8

Report
Report Interact

Report Author: Samim Imtiaz

156

Scatter Combo Combo Bar Donut Real Estate

Share template with others

This interactive Power BI report explores the European Real Estate Market Analytics dataset using ZoomCharts Drill Down custom visuals for Power BI. It highlights property prices, price per square meter, listing activity, and property characteristics across countries and cities, helping users identify market trends, compare locations, and evaluate investment opportunities.

The report was submitted to the FP20 Analytics ZoomCharts Data Challenge #36 (March – April 2026).


Author’s Description:

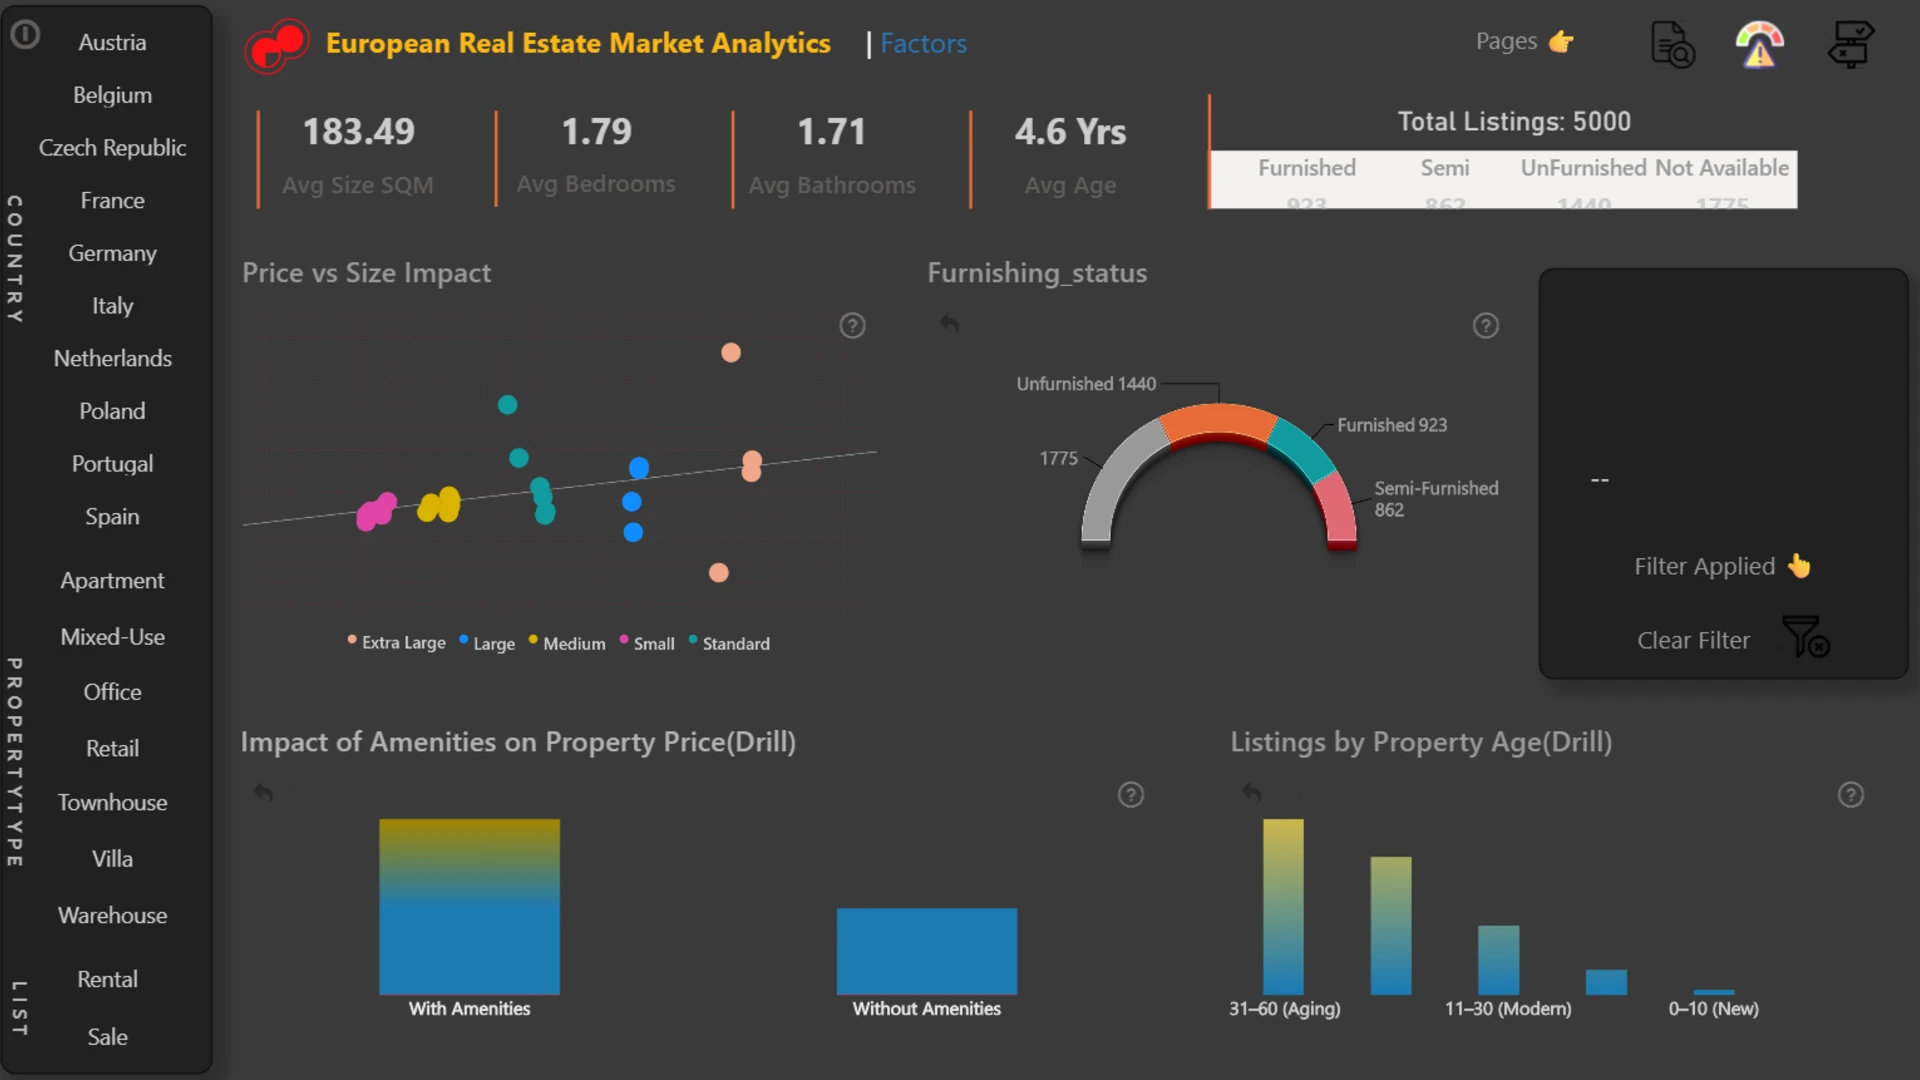
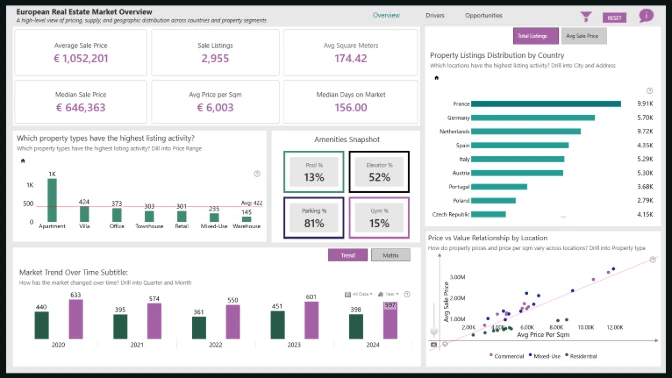
This Power BI report analyzes the European real estate market to support decision-making for investors, analysts, and business stakeholders. The dashboard is structured into three key sections: Overview-market summary, including average prices, price per sqm, and listing distribution; Factors-analysis of key drivers such as property size, amenities, and property age; and Investment-identification of opportunities, market trends, and detailed property-level insights.

ZoomCharts Drill Down visuals enable interactive exploration across multiple dimensions, such as country, property type, and listing type. Key insights include a strong relationship between property size and price, higher valuations for properties with amenities, and significant variation in market activity across regions and property categories. This report is designed for intuitive navigation, combining high-level summaries with deep drill-down capabilities.

ZoomCharts visuals used

Drill Down Shape Map PRO Drill Down Shape Map PRO
Drill Down Scatter PRO Drill Down Scatter PRO
Drill Down Combo PRO Drill Down Combo PRO
Drill Down Combo Bar PRO Drill Down Combo Bar PRO
Drill Down Donut PRO Drill Down Donut PRO

Need help?

Send your question to ZoomCharts assistant, and we will respond to you as soon as possible.

Contact Us

Mobile view allows you to interact with the report. To Download the template please switch to desktop view.

Similar reports

All Reports13 results
New
Report Card

Real Estate Listings & Pricing Explorer 2

582

New
Report Card

EU Property Market Analysis Dashboard

606

New
Report Card

Real Estate Investment Insights Dashboard 7

19

Explore all reports

Was this helpful? Thank you for your feedback!

Sorry about that.

How can we improve it?

Real Estate Investment Insights Dashboard 8

Report Author: Samim Imtiaz

156

ZoomCharts

Welcome to ZoomCharts

You’re almost there! Create an account to download reports.

or
Sign up with Microsoft

Verify your email address

We have sent a code to your email address. Please input the code below.

Didn't receive code? Request again (after 30 seconds)

Already have an account? Log in

ZoomCharts

Log in to your ZoomCharts account

Log in with Microsoft
or
Forgot password?

Reset your password

We'll email you instructions on how to reset your password

Don't have an account? Sign up

Please add credits

You have 0 available downloads.
Get more credits or upgrade your plan to continue.

View pricing
logo
[email protected]
+44 204 577 3993
logo

Products

Drill Down Bubble PRO Drill Down Line PRO Drill Down Network PRO Drill Down Waterfall PRO Drill Down Graph PRO Drill Down Combo PRO Drill Down Combo Bar PRO Drill Down Donut PRO Drill Down Pie PRO Drill Down TimeSeries PRO Drill Down Timeline PRO Drill Down Map PRO Drill Down Scatter PRO All Visuals

Resources

Report Examples Webinars Blog ZoomCharts Academy Visuals Gallery Documentation Custom Visual Development Subscribe to News

Solutions

Custom Visual Development

Company

Pricing About Us Partners Leave feedback Join PowerGroup EU Funding

Help

ZoomCharts Assistance Contact Sales Contact Support FAQ AI Information

Drill Down Line PRO Drill Down Bubble PRO Drill Down Network PRO Drill Down Waterfall PRO Drill Down Graph PRO Drill Down Combo PRO Drill Down Combo Bar PRO Drill Down Donut PRO Drill Down Pie PRO Drill Down TimeSeries PRO Drill Down Timeline PRO Drill Down Map PRO Drill Down Scatter PRO All Visuals

Report Examples Webinars Blog ZoomCharts Academy Visuals Gallery Documentation Custom Visual Development Subscribe to News

Custom Visual Development

Pricing About Us Partners Leave feedback Join PowerGroup EU Funding

ZoomCharts Assistance Contact Sales Contact Support FAQ AI Information
+44 204 577 3993
[email protected]

Ready to get in touch?

Contact our experts with any question about Power BI and ZoomCharts for Free!

Contact us

© 2026, Data Visualization Software Lab

U.S. Patents No. 11,645,343; 11,921,804; 12,346,389

Cookies
Privacy Policy
Global
Legal
Patent
warning

Error message

success

Success info: Done!

ZoomCharts AI Assistant

We noticed you're using an old OS version.

For the best experience, we recommend upgrading to ensure that all website features display correctly.

Cookie settings

We use necessary cookies for site functionality, as well as statistic, marketing, and preference cookies to enhance your experience. For more information and to manage your preferences, please visit our Cookie policy