512
Project Management Power BI Report 4
Project Management Power BI Report 4

Report Author: Akindele Omolayo
512
Share template with others
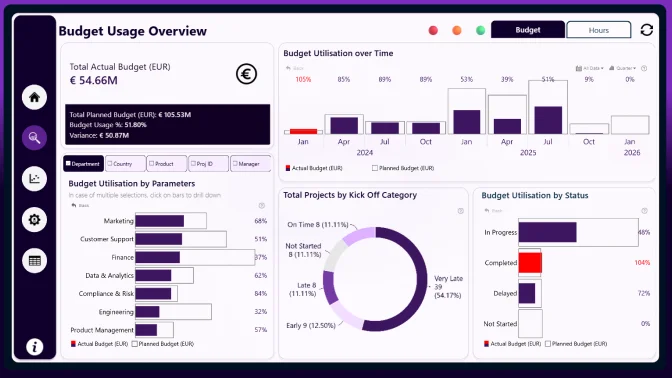
This Power BI report uses the Fintech Project Management dataset and features ZoomCharts Drill Down PRO custom visuals for Power BI. It was submitted to the FP20 Analytics ZoomCharts Data Challenge 32 in November 2025.
Author's Description:
This report provides a comprehensive analysis of project cost efficiency, delivery performance, and workforce productivity across the organization. Designed to support data-driven decision-making, the dashboard brings together key financial, operational, and human-resource indicators to reveal patterns in project success, cost behavior, and departmental performance.
ZoomCharts visuals used
Need help?
Send your question to ZoomCharts assistant, and we will respond to you as soon as possible.
Contact UsMobile view allows you to interact with the report. To Download the template please switch to desktop view.

Was this helpful? Thank you for your feedback!
Sorry about that.
How can we improve it?