1996
South America Population & Urbanization Power BI Dashboard
South America Population & Urbanization Power BI Dashboard
More Report pages
Report Author: Jason Carl Martin Tupas
1996
Share template with others
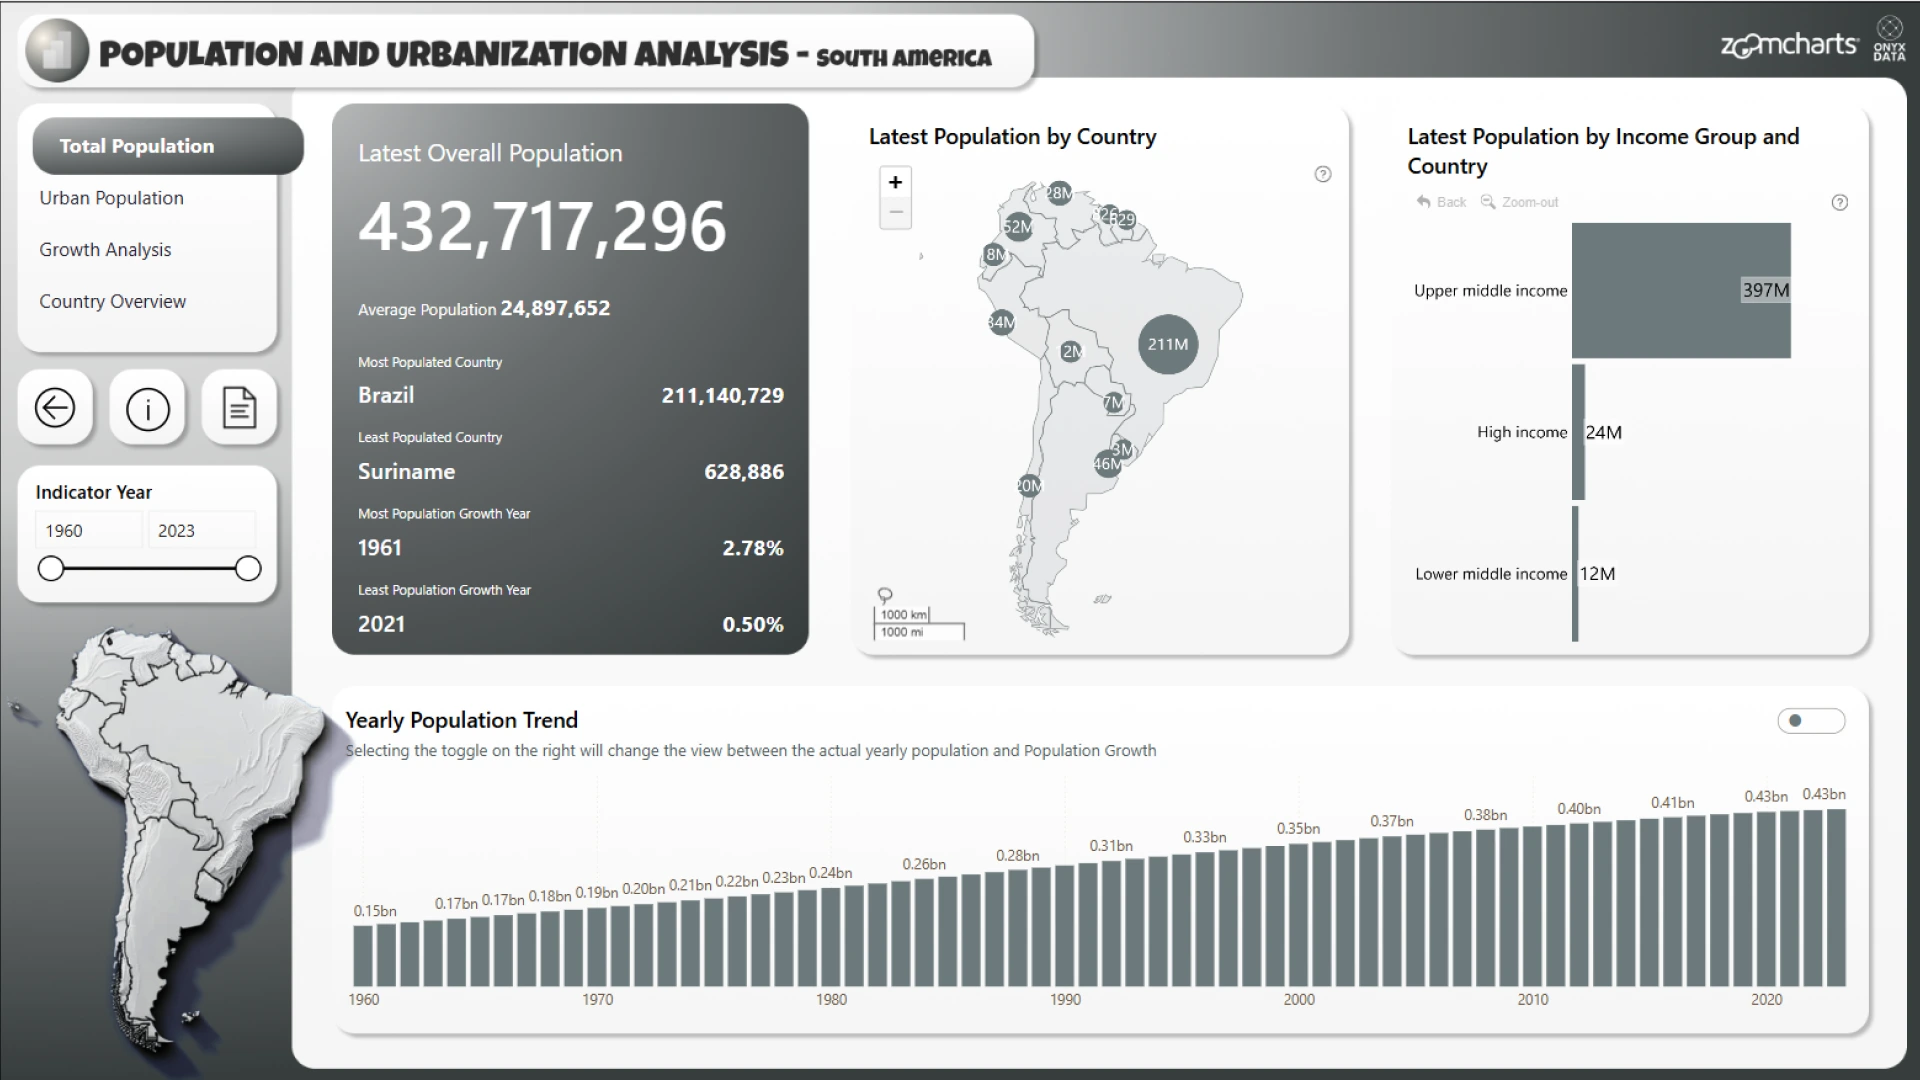
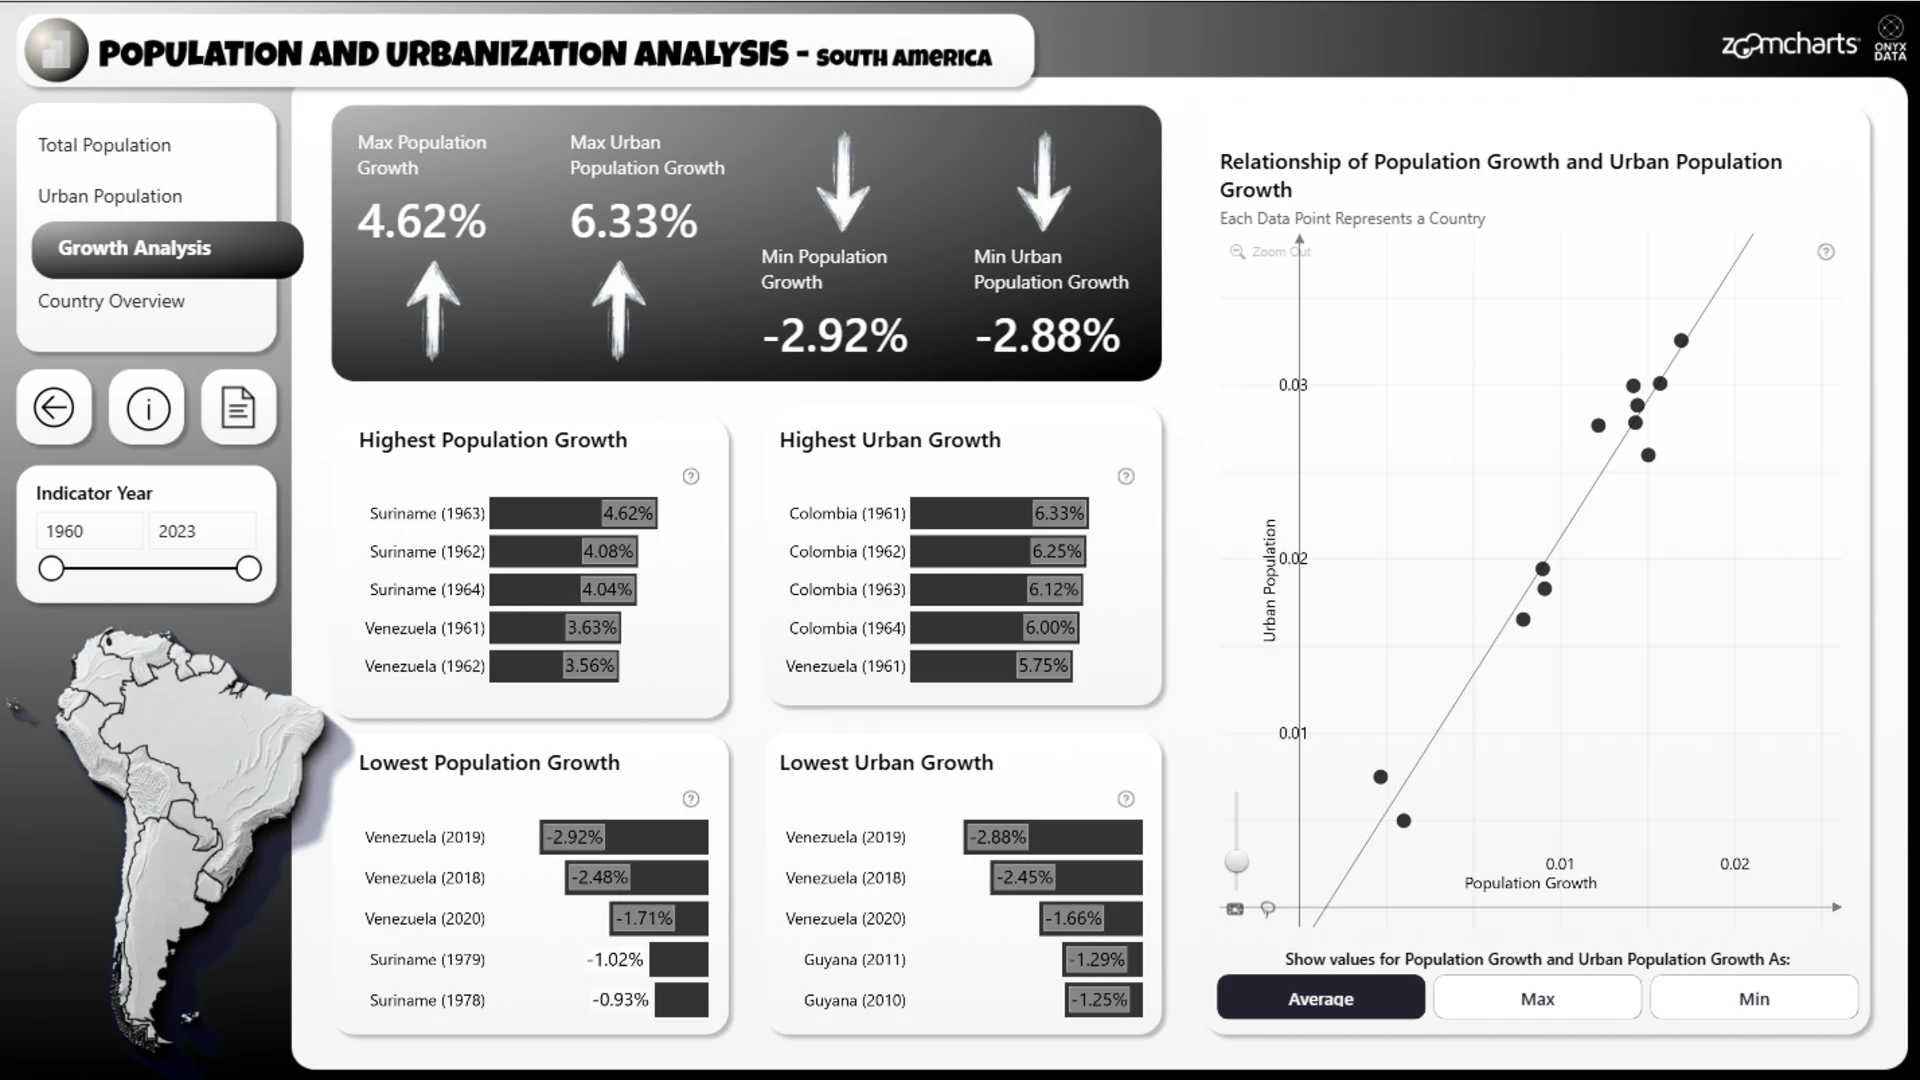
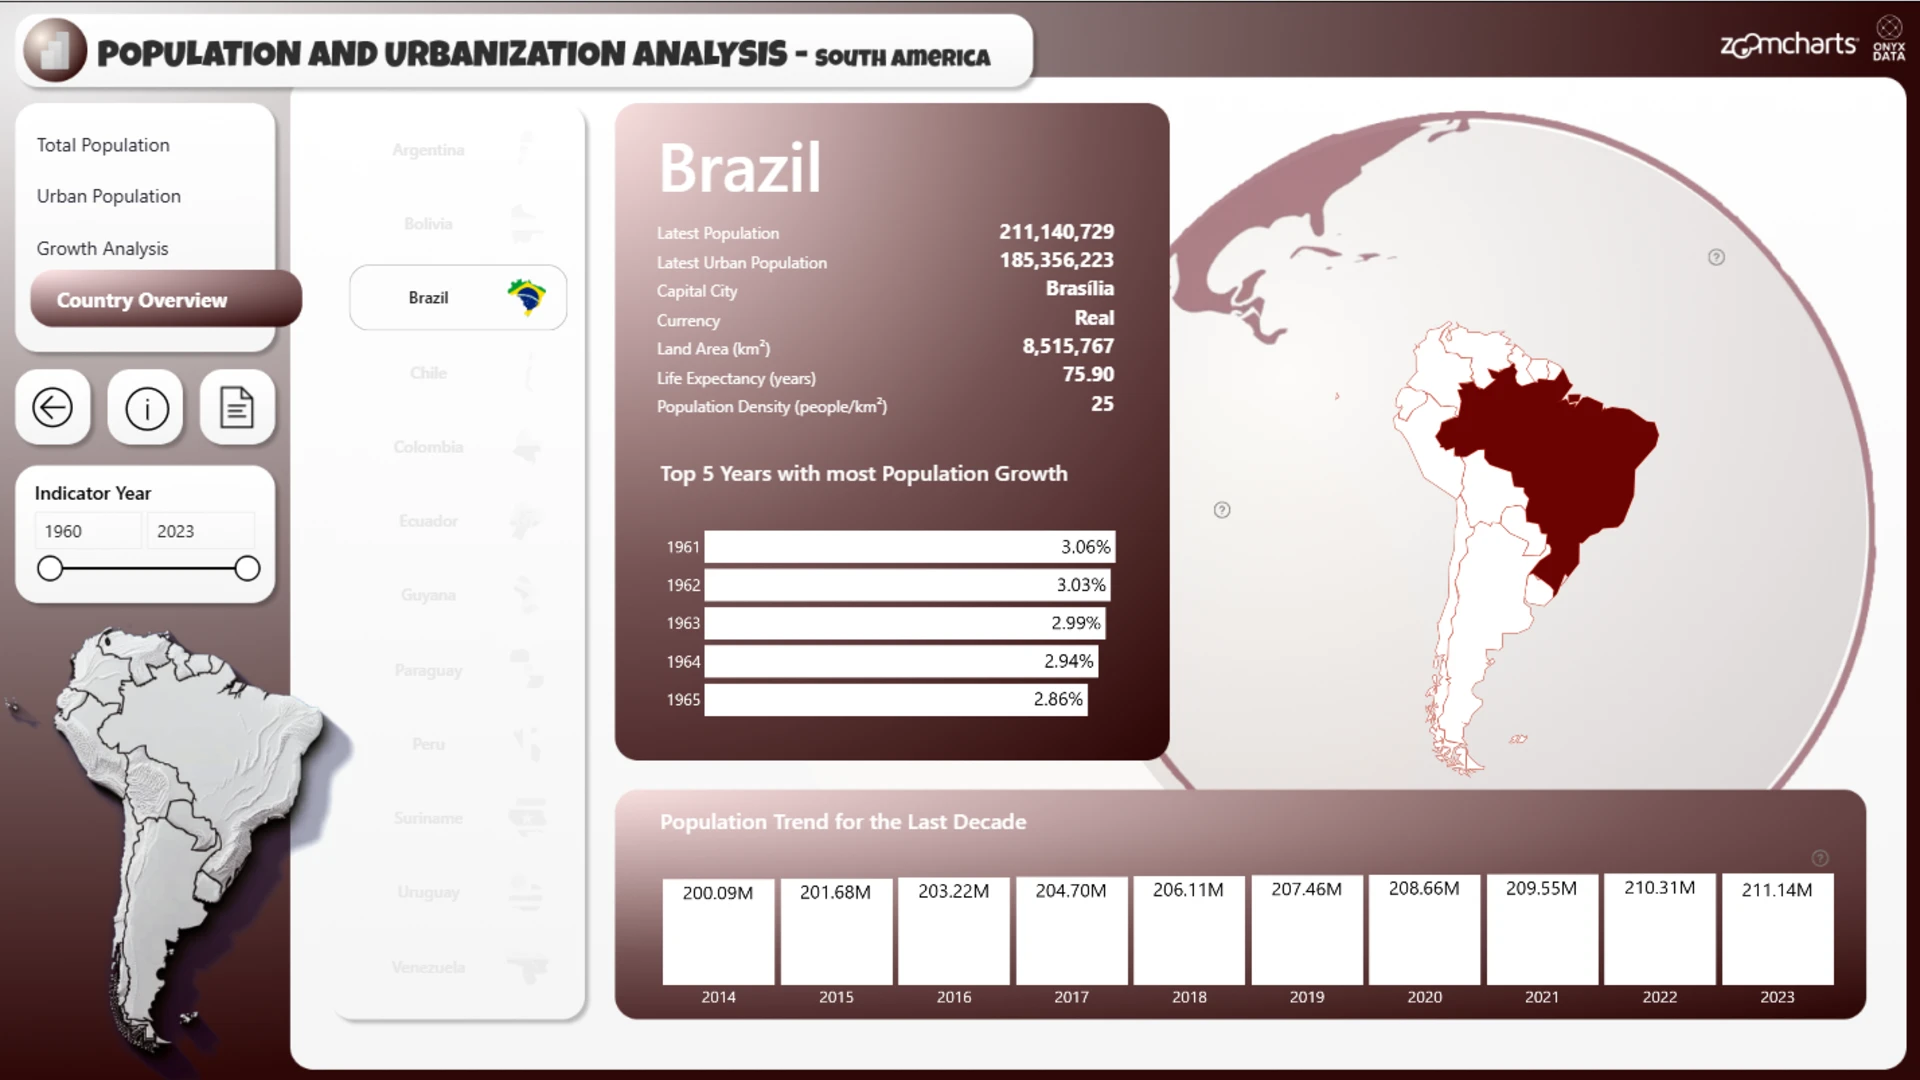
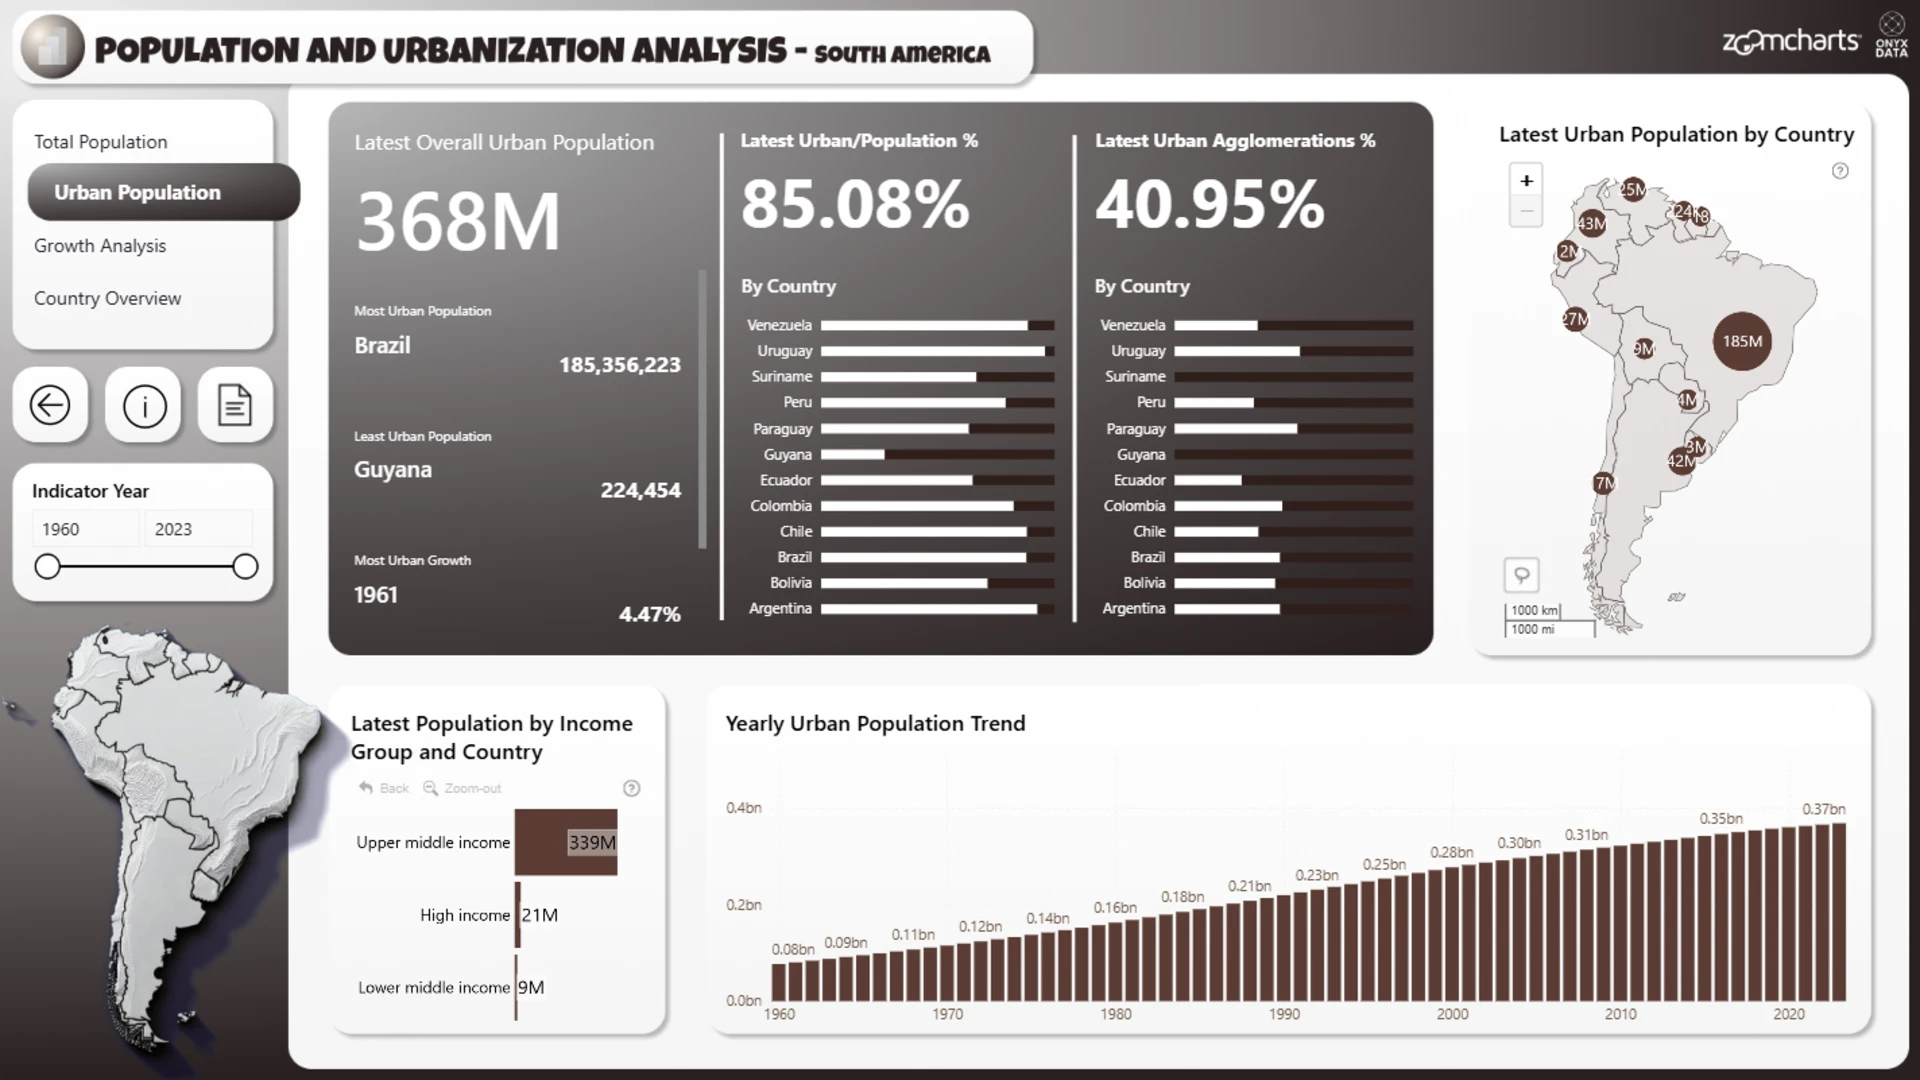
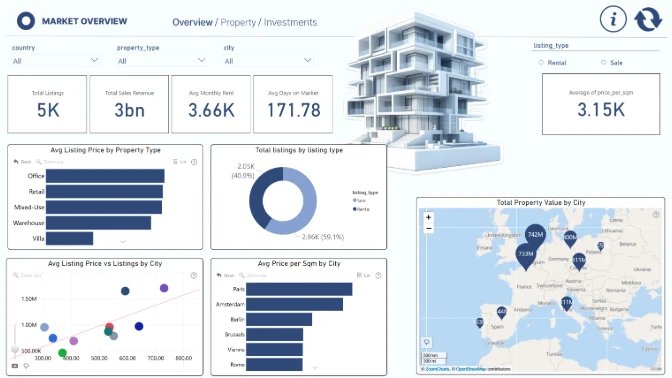
Explore a South America Population & Urbanization Power BI Dashboard built to analyze population growth, urban population trends, income group distribution, and country-level demographic patterns. This dashboard example helps users compare total and urban population changes over time, identify countries with the highest and lowest growth rates, and understand how urbanization varies across South America through interactive maps, trend charts, bar charts, and scatter analysis.
4U Report Challenges
Participate in data challenges, build and submit reports to get free template downloads.
Join CommunityMobile view allows you to interact with the report. To Download the template please switch to desktop view.


Was this helpful? Thank you for your feedback!
Sorry about that.
How can we improve it?