701
Paralympics Games Analysis
Paralympics Games Analysis
More Report pages
Report Author: Pratyush Majumdar
701
Share template with others
Report submitted for Onyx Data DataDNA ZoomCharts Mini Challenge, September 2024. The report was built based on Paralympic Games dataset and includes ZoomCharts custom Drill Down PRO visuals for Power BI.
Author's description:
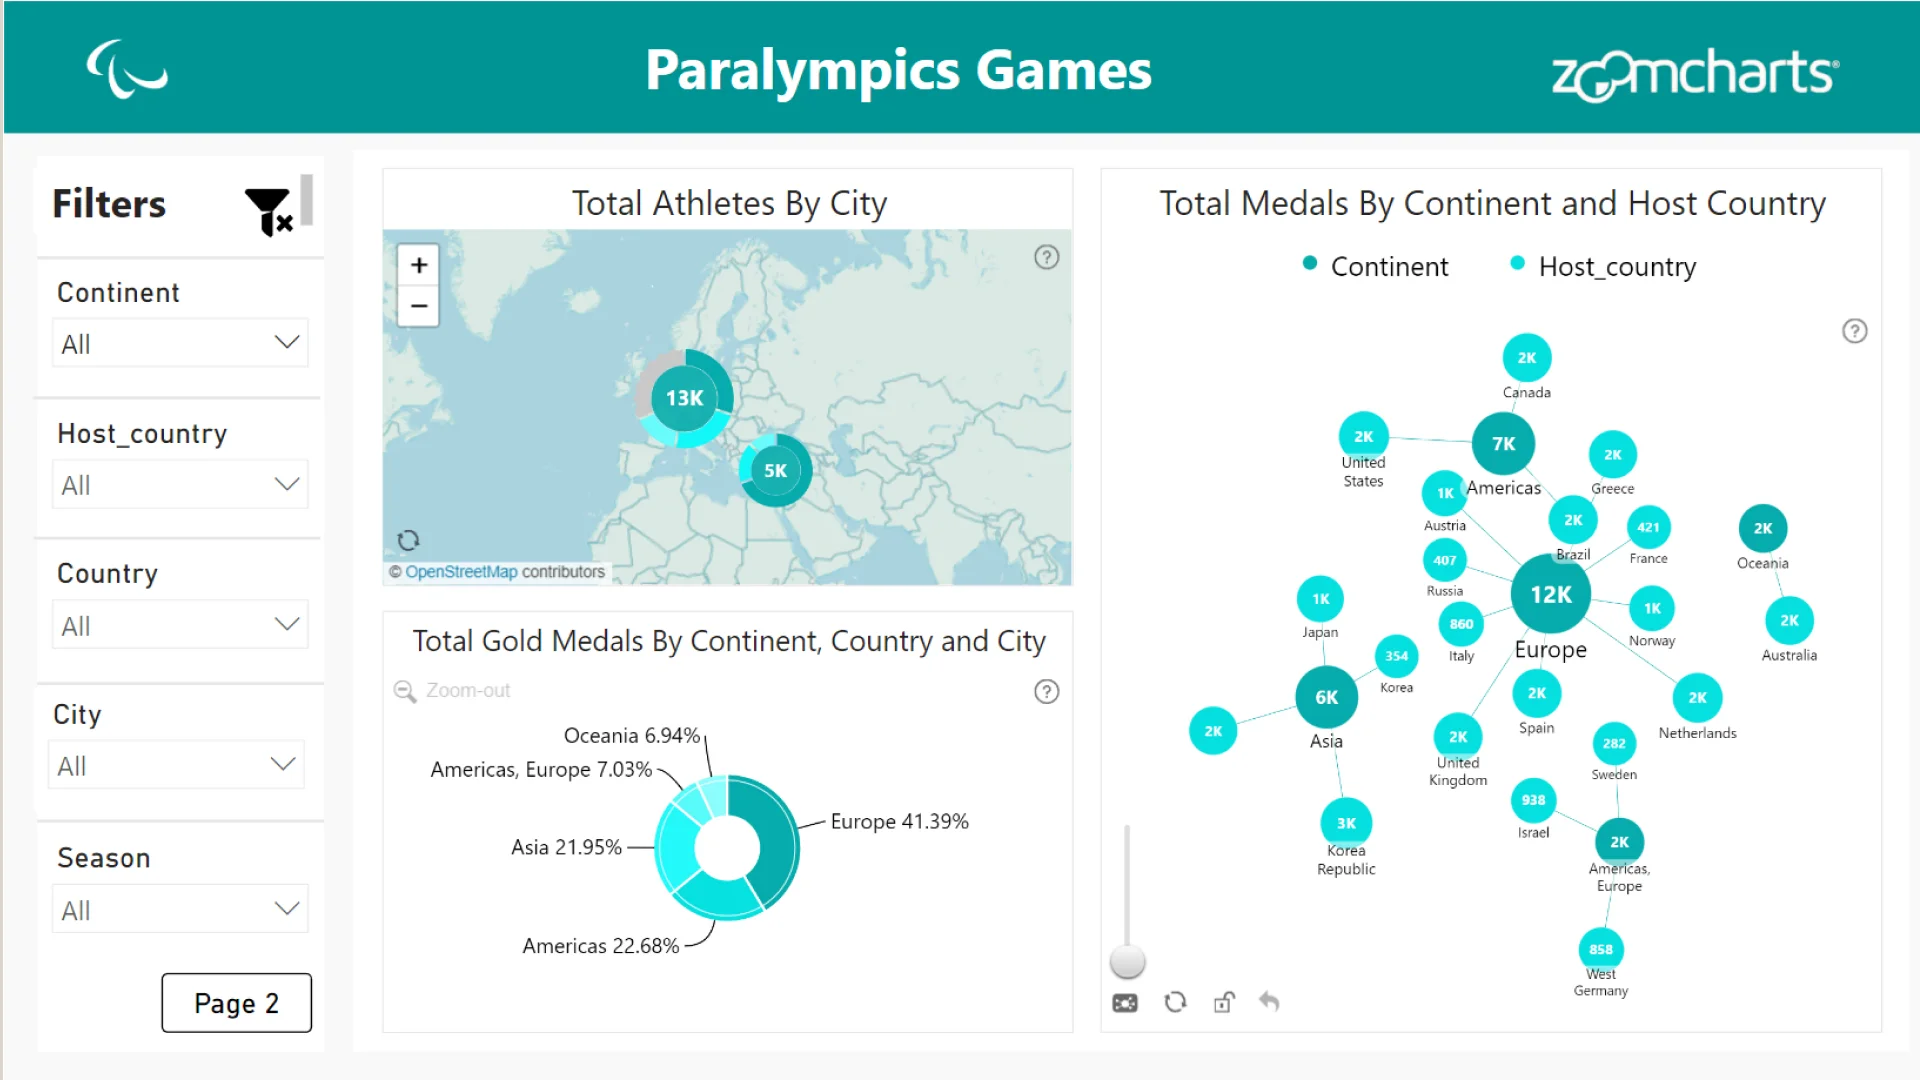
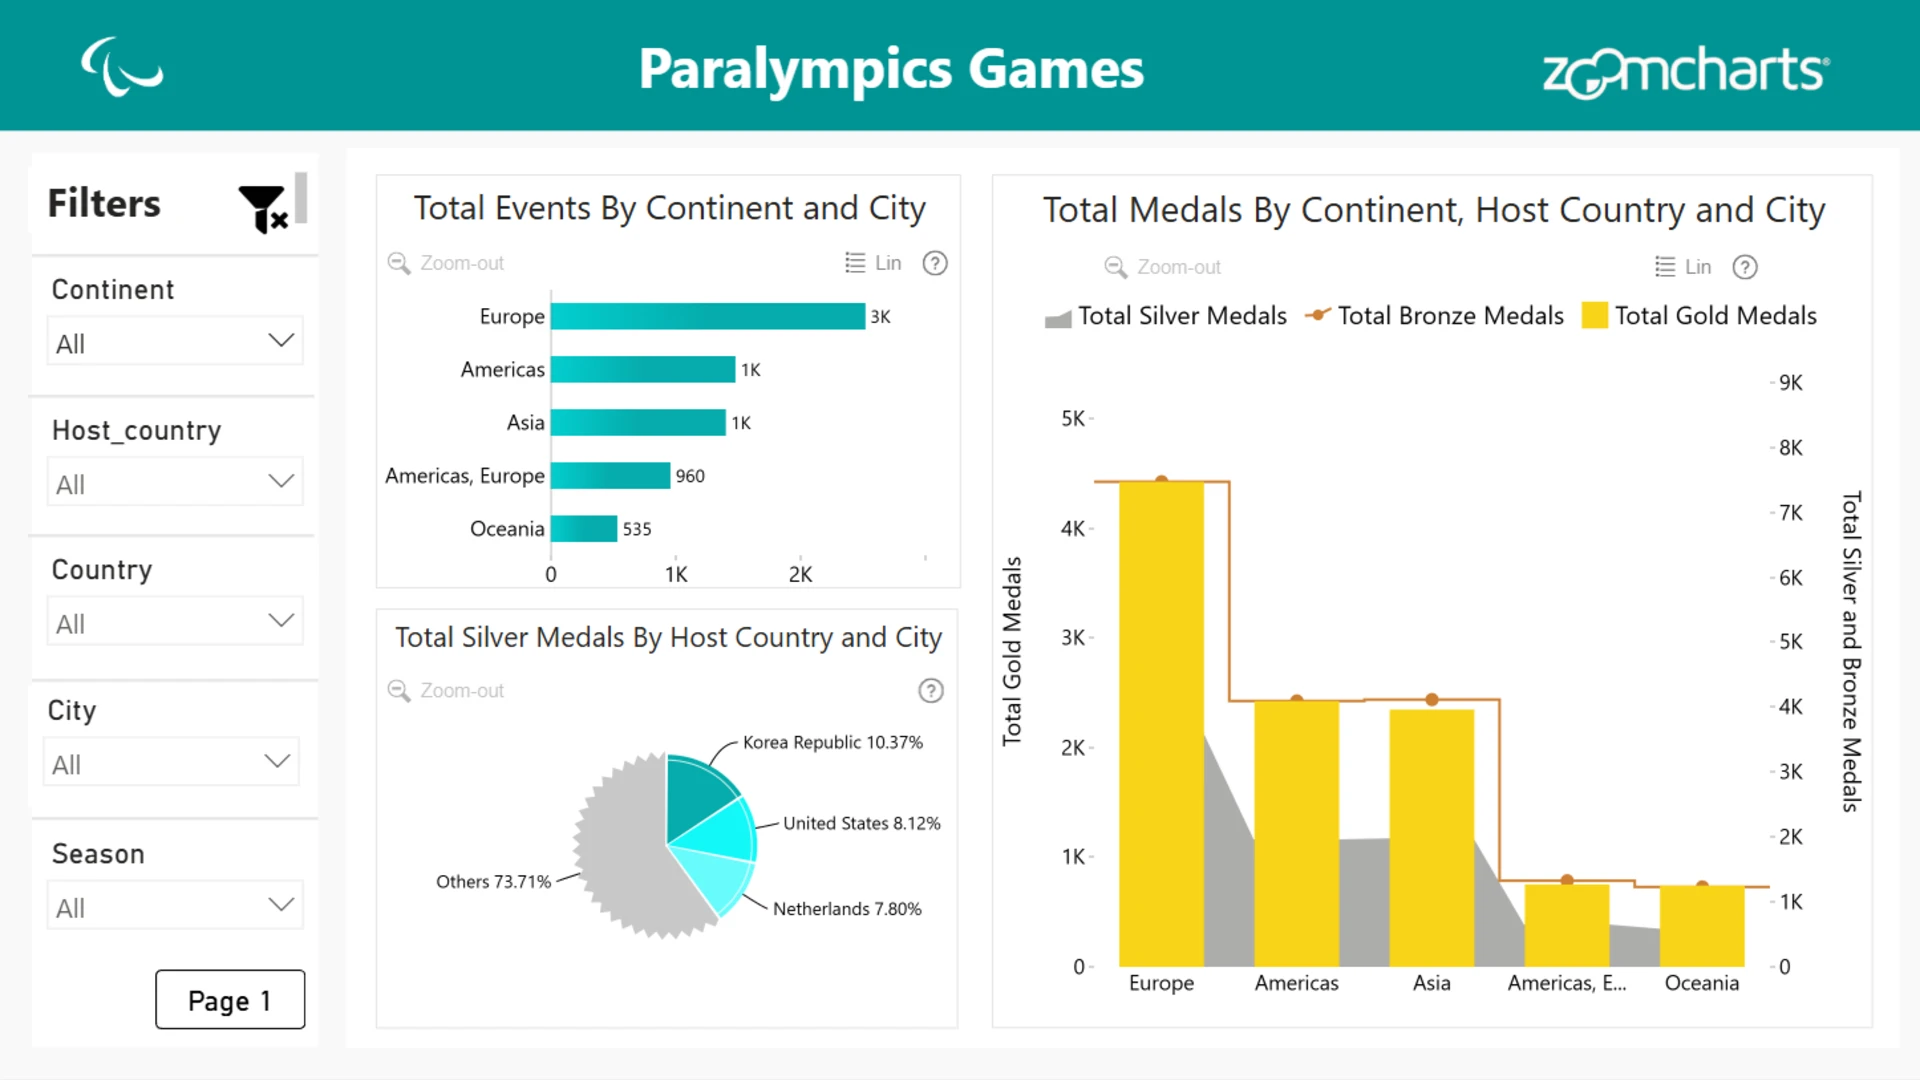
Created interactive Power BI reports to analyze and visualize key statistics from the Paralympic Games. Utilized various types of drill-down charts, enabling users to explore the data at multiple levels of detail.
The key visualizations included: 1) Drill down combo pro 2) Drill down bar pro 3) Drill down map pro 4) Drill down network pro 5) Drill down donut pro 6) Drill down pie pro
ZoomCharts visuals used
4U Report Challenges
Participate in data challenges, build and submit reports to get free template downloads.
Join CommunityMobile view allows you to interact with the report. To Download the template please switch to desktop view.


Was this helpful? Thank you for your feedback!
Sorry about that.
How can we improve it?