1244
Paralympic Games from 1960 to 2018
Paralympic Games from 1960 to 2018
More Report pages
Report Author: Zakaria Fadili
1244
Share template with others
Report submitted for Onyx Data DataDNA ZoomCharts Mini Challenge, September 2024. The report was built based on Paralympic Games dataset and includes ZoomCharts custom Drill Down PRO visuals for Power BI.
Author's description:
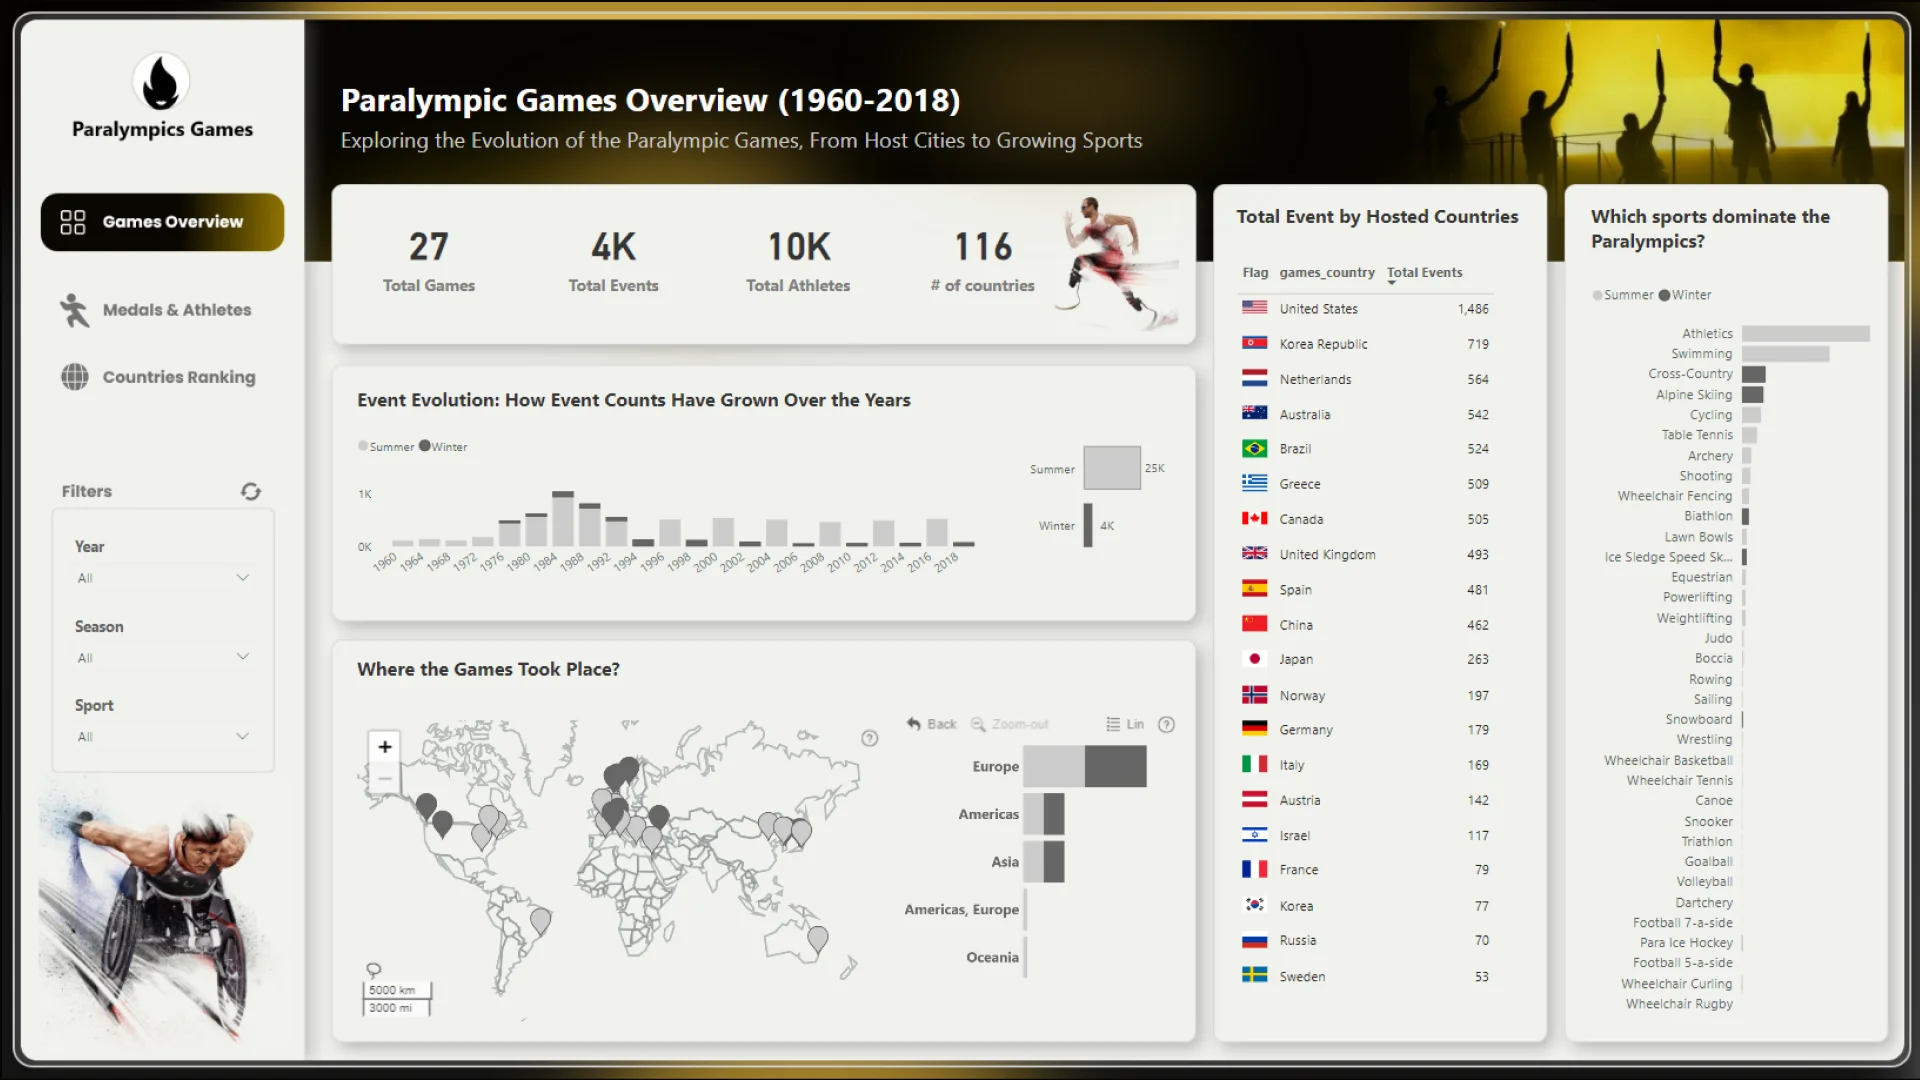
This Power BI report provides an overview of the **Paralympic Games from 1960 to 2018** across three themed pages.
The first page, **"Paralympic Games: A Global Journey,"** highlights key details about the host cities, seasons, and the evolution of sports during this period.
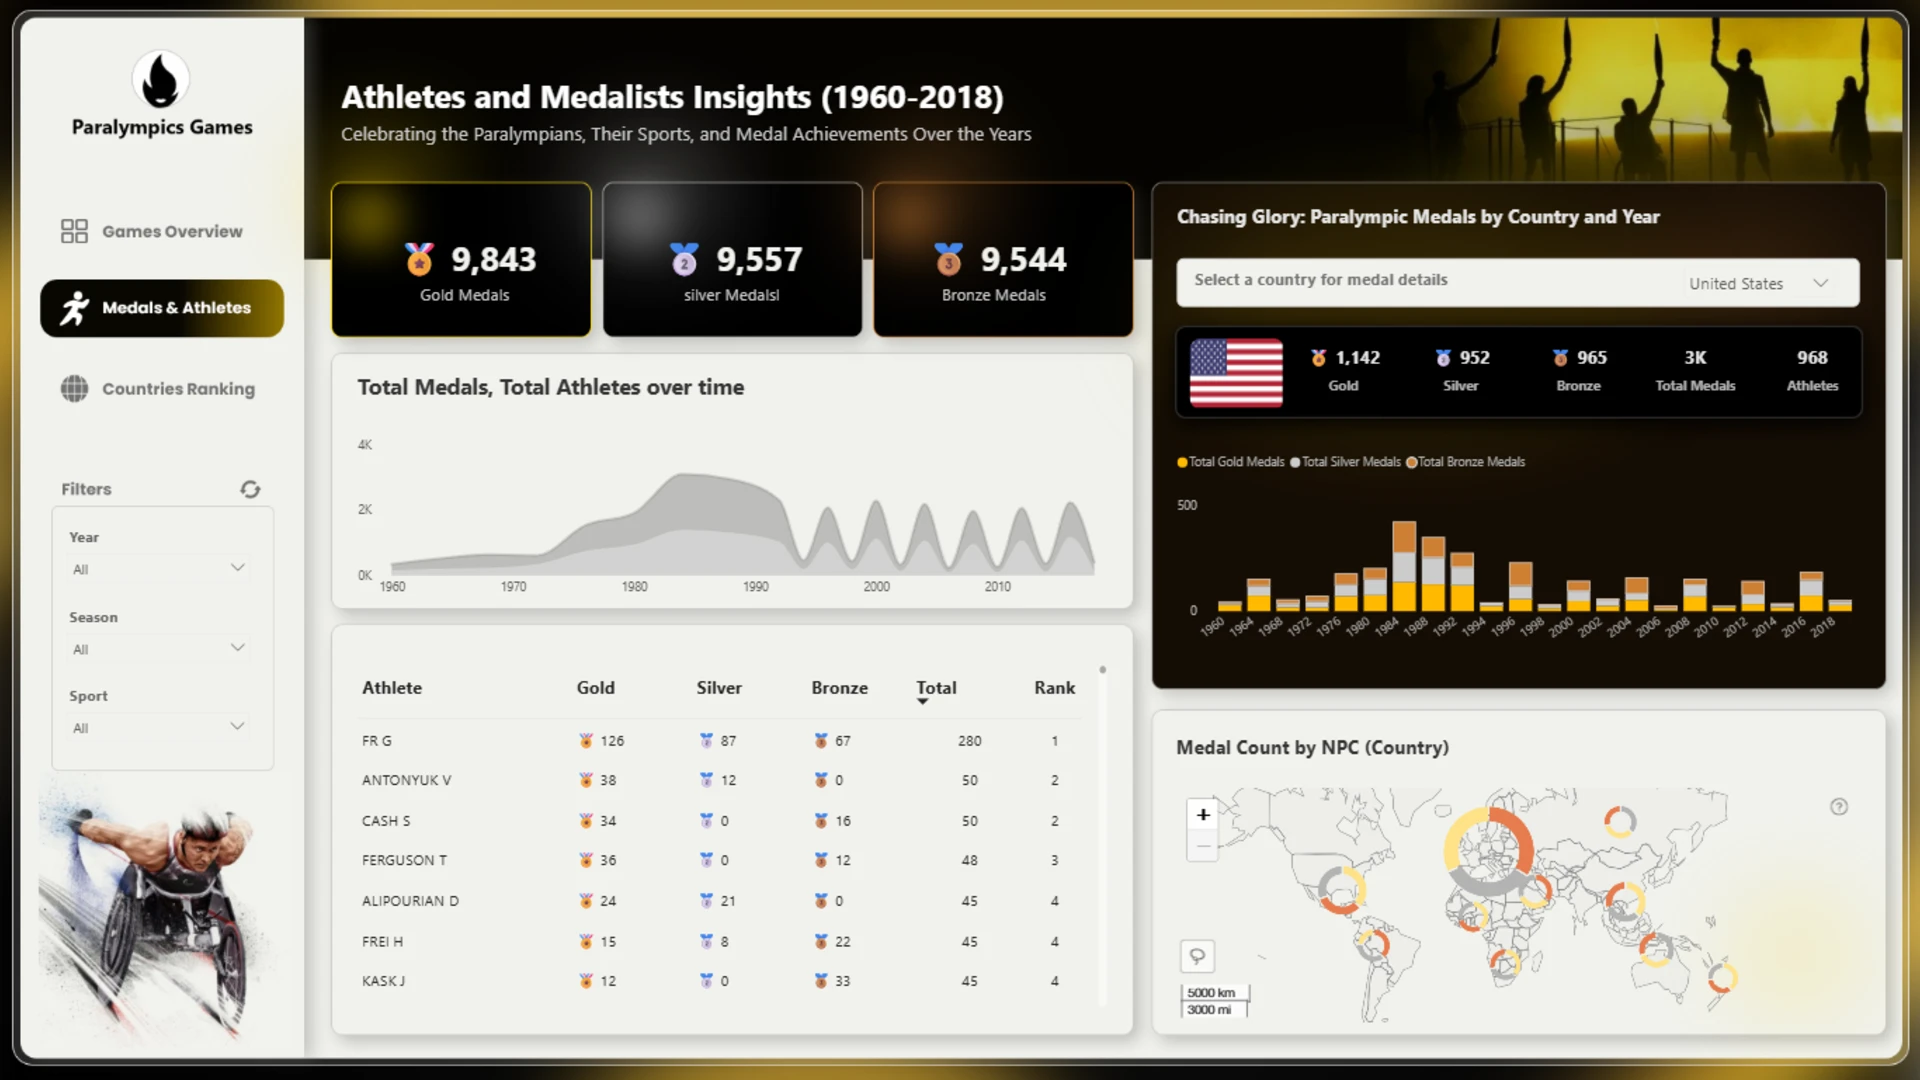
The second page, **"Athletes and Medals,"** focuses on the achievements of athletes, showing medal counts and the sports they competed in.
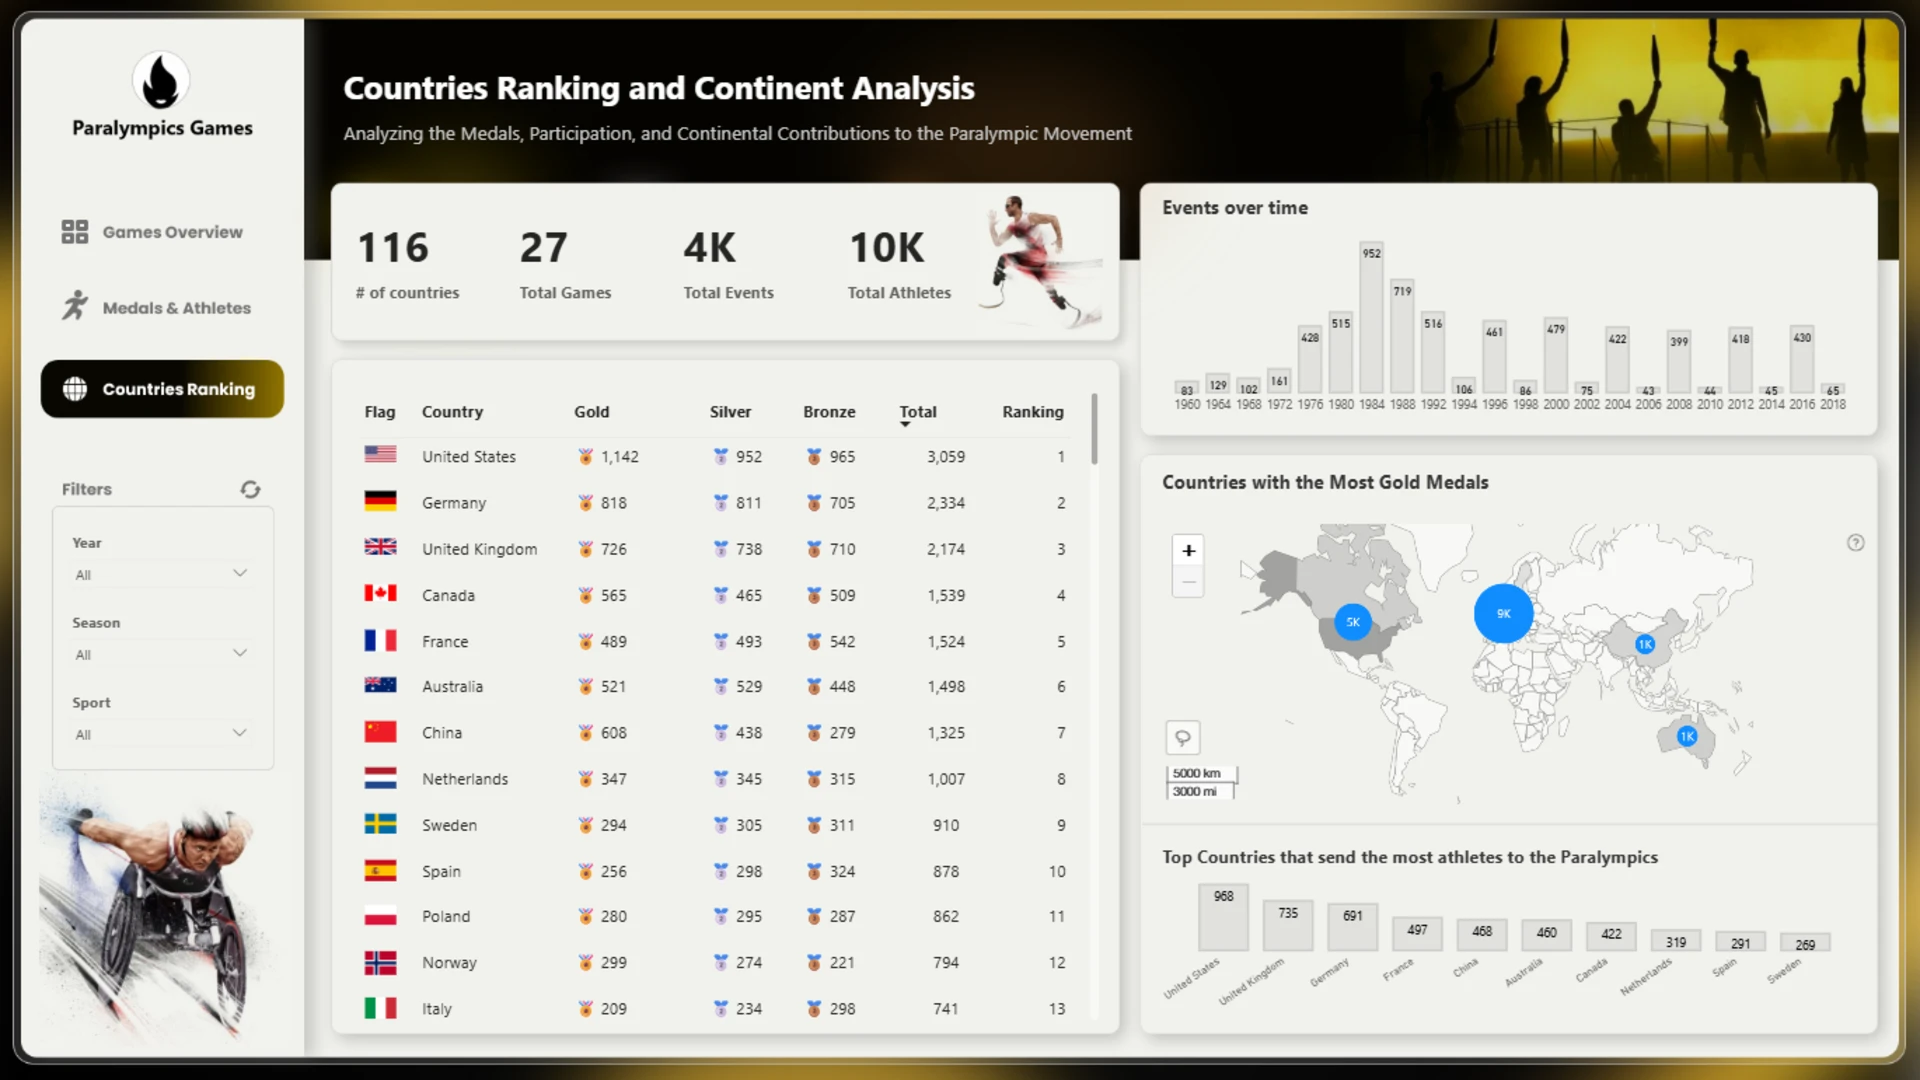
The third page, **"Nations and Continents,"** ranks countries by performance and participation, while also examining the contribution of each continent. Each page tells a story through data, illustrating the global impact of the Paralympic Games.
4U Report Challenges
Participate in data challenges, build and submit reports to get free template downloads.
Join CommunityMobile view allows you to interact with the report. To Download the template please switch to desktop view.
Was this helpful? Thank you for your feedback!
Sorry about that.
How can we improve it?