718
Paralympic Games Analysis
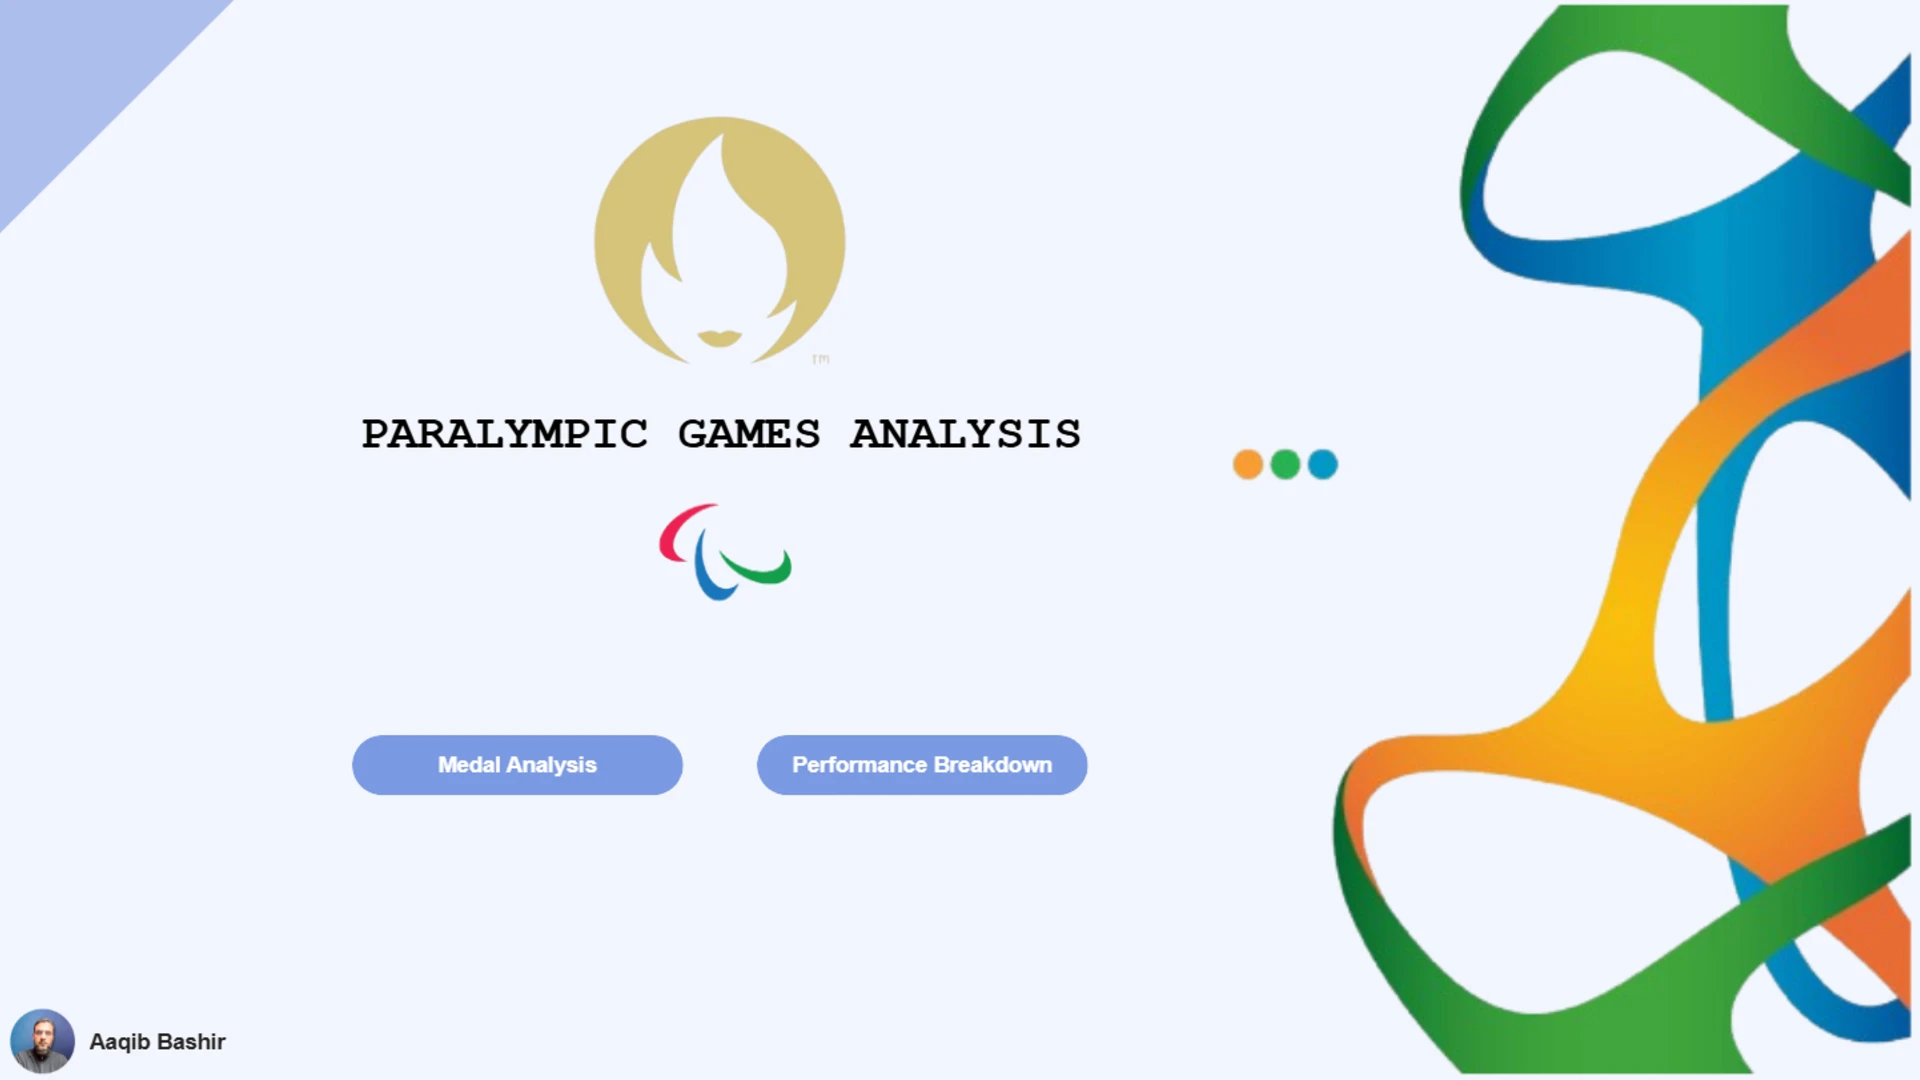
Paralympic Games Analysis
More Report pages
Report Author: Aaqib Bashir
718
Share template with others
Report submitted for Onyx Data DataDNA ZoomCharts Mini Challenge, September 2024. The report was built based on Paralympic Games dataset and includes ZoomCharts custom Drill Down PRO visuals for Power BI.
Author's description:
The project focused on analyzing Paralympics data to uncover insights into athlete performance, medal standings, and country participation. The aim was to develop an engaging and informative Power BI dashboard that presented a clear overview of Paralympic achievements over the years. The dashboard was organized into two comprehensive pages:
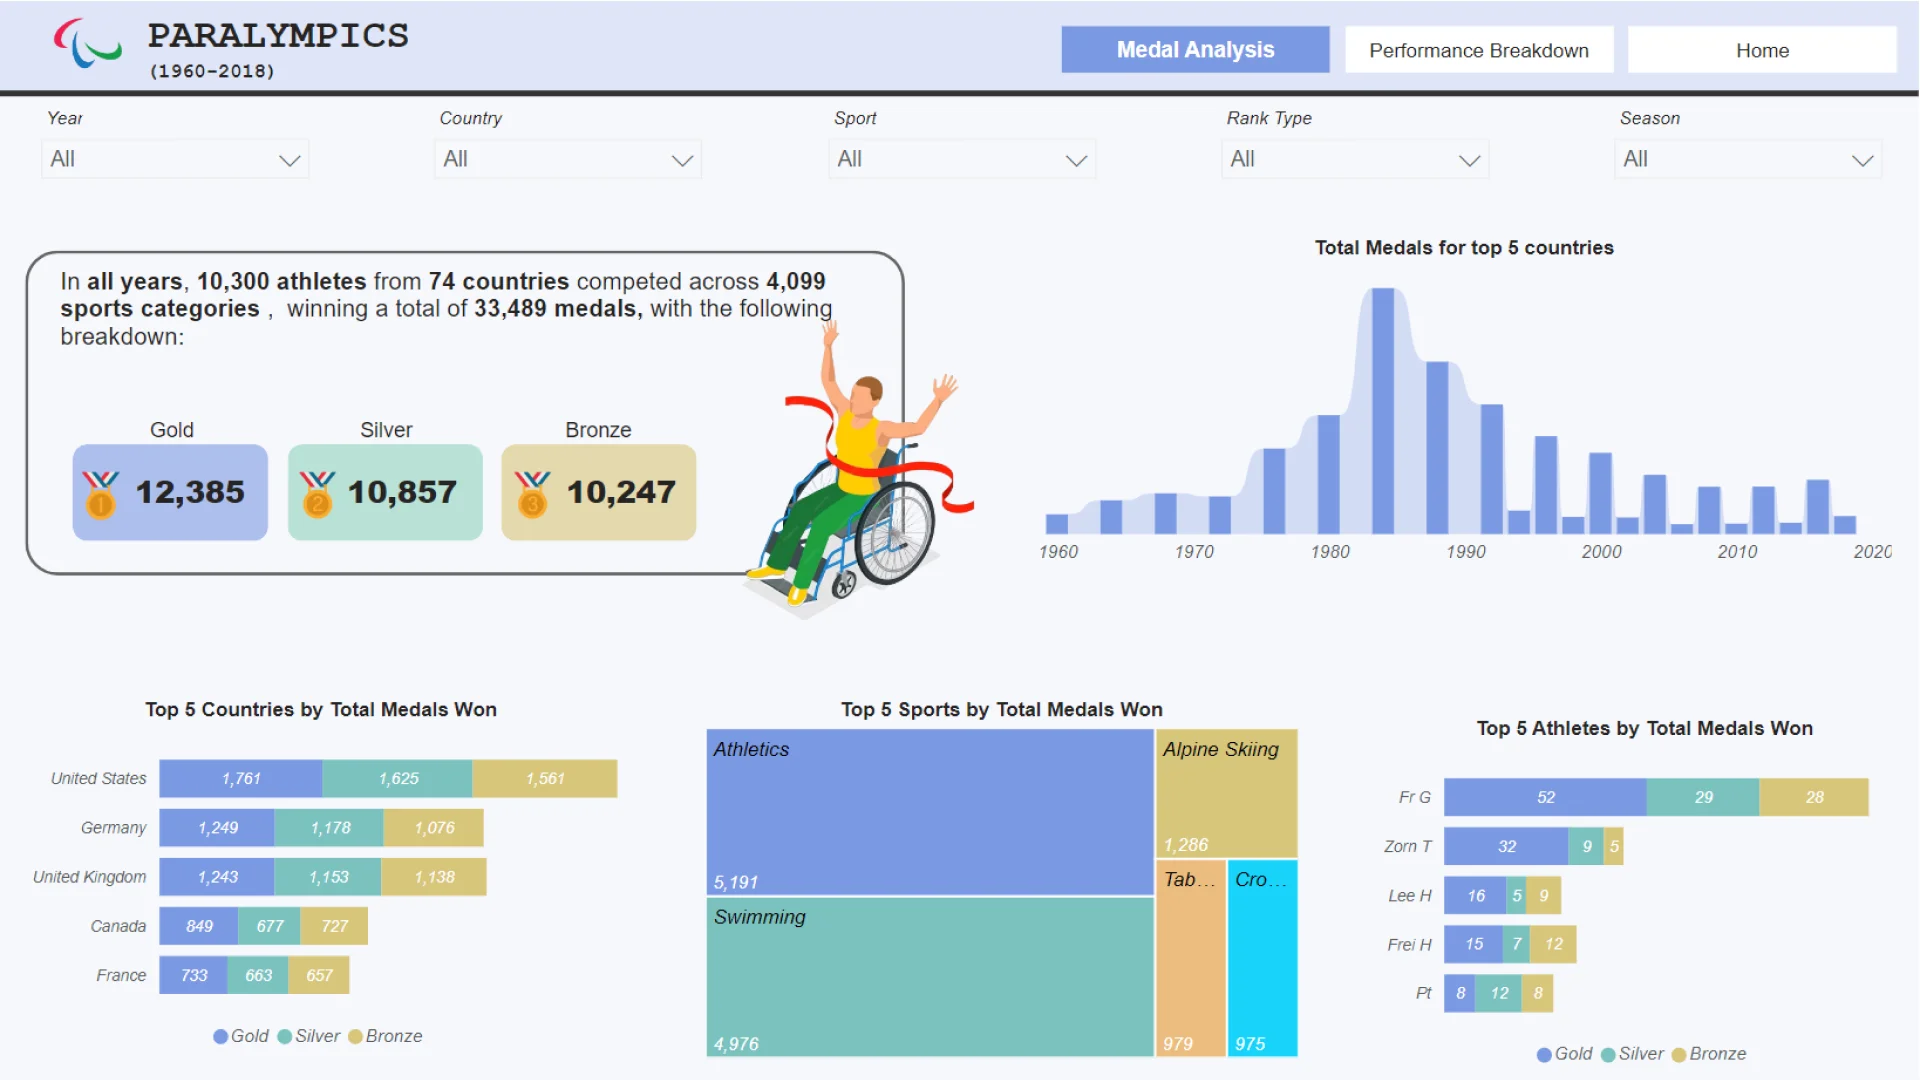
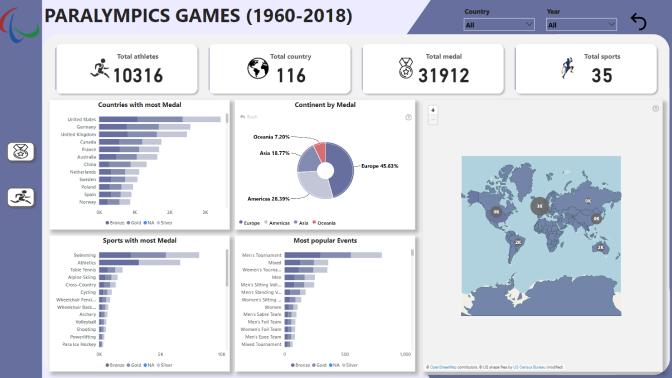
1. 𝗠𝗲𝗱𝗮𝗹 𝗢𝘃𝗲𝗿𝘃𝗶𝗲𝘄 – Showcasing the overall medal standings, country participation, and athlete distribution across different sports. This page included visuals such as top-performing countries by medal count, growth trends in participation, and a breakdown of medal types per country.
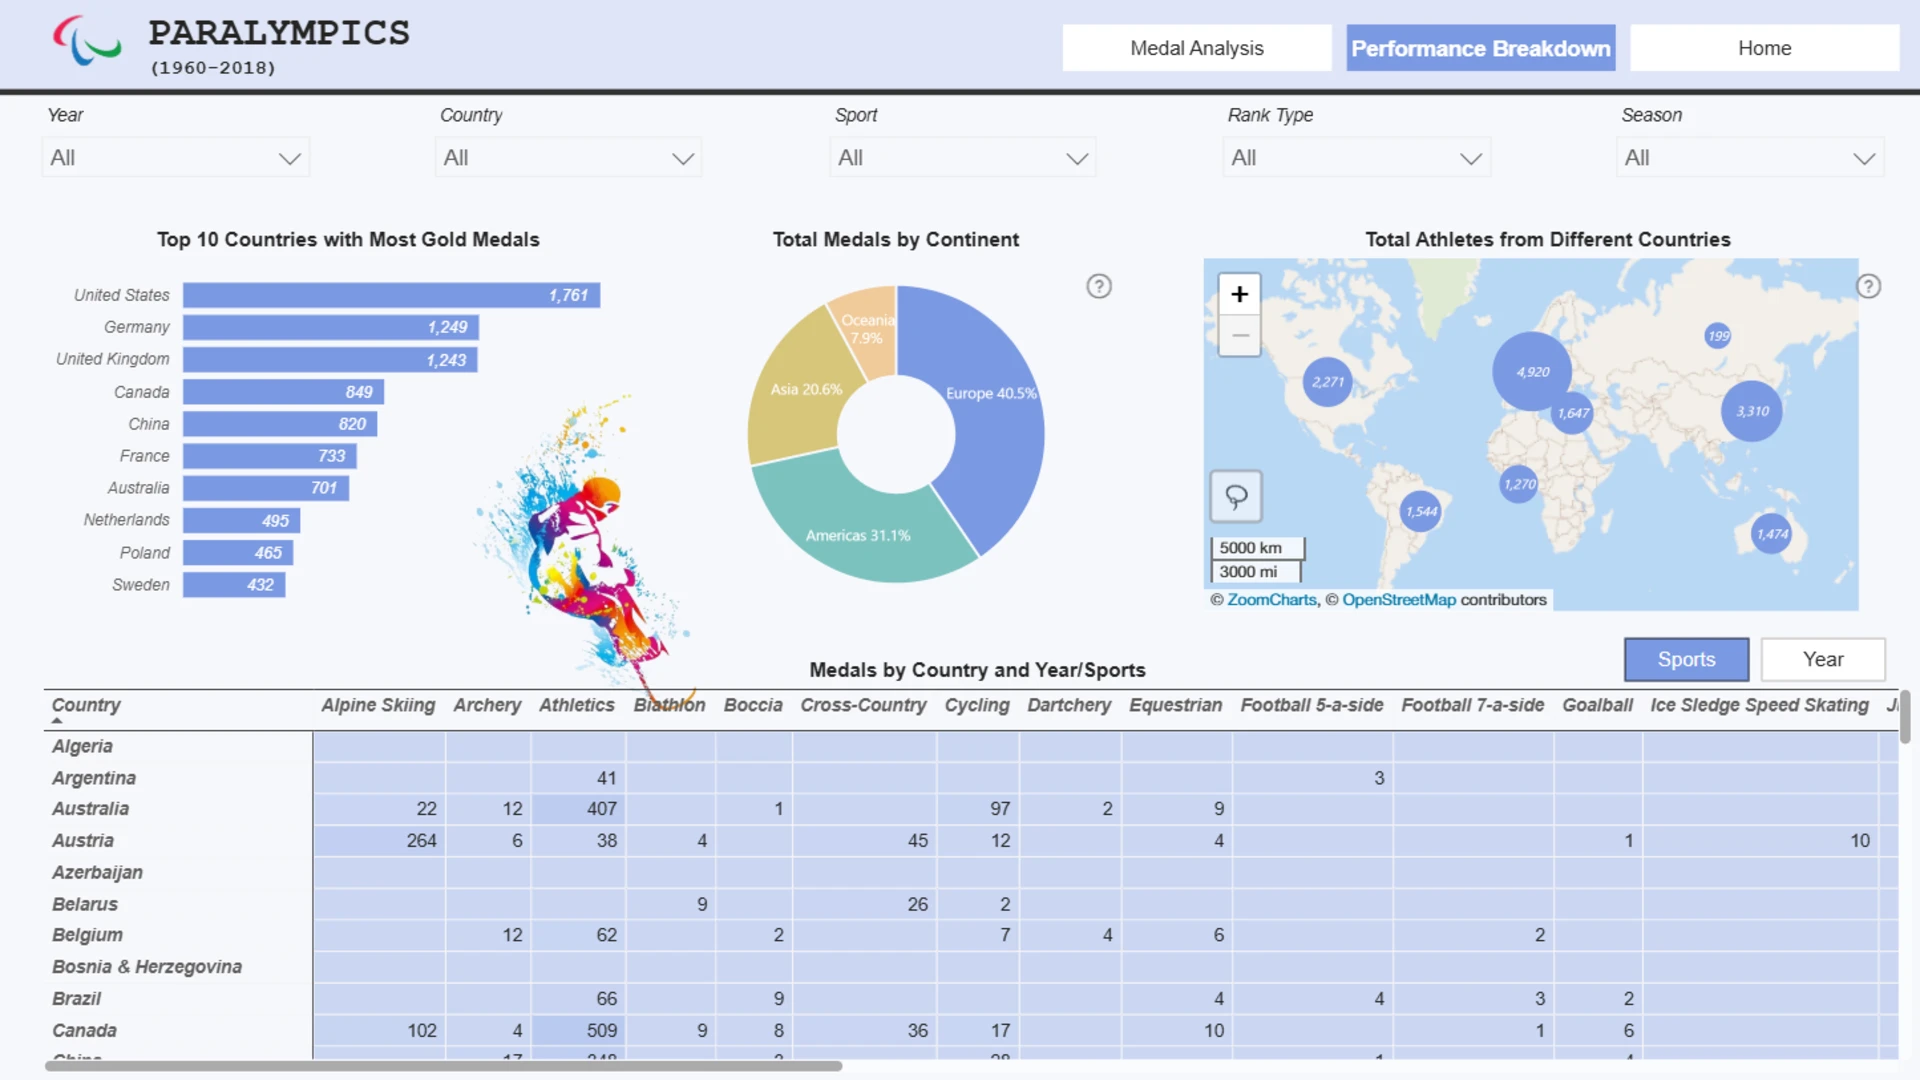
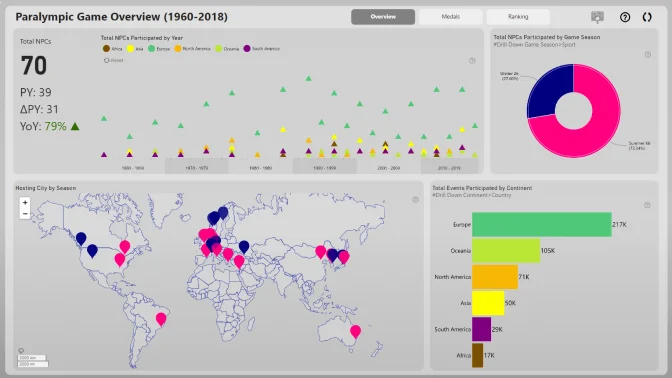
2. 𝗣𝗲𝗿𝗳𝗼𝗿𝗺𝗮𝗻𝗰𝗲 𝗕𝗿𝗲𝗮𝗸𝗱𝗼𝘄𝗻 – Providing a detailed analysis of countries' performance, focusing on gold medal winners, total medal achievements over the years, and geographical breakdowns of medals and athletes. Insightful visuals helped to explore patterns and trends in the data, offering a comprehensive view of Paralympic achievements globally.
4U Report Challenges
Participate in data challenges, build and submit reports to get free template downloads.
Join CommunityMobile view allows you to interact with the report. To Download the template please switch to desktop view.
Was this helpful? Thank you for your feedback!
Sorry about that.
How can we improve it?