1133
Paralympic Game Dashboard
Paralympic Game Dashboard

More Report pages
Report Author: Ogungbile Marvelous
1133
Share template with others
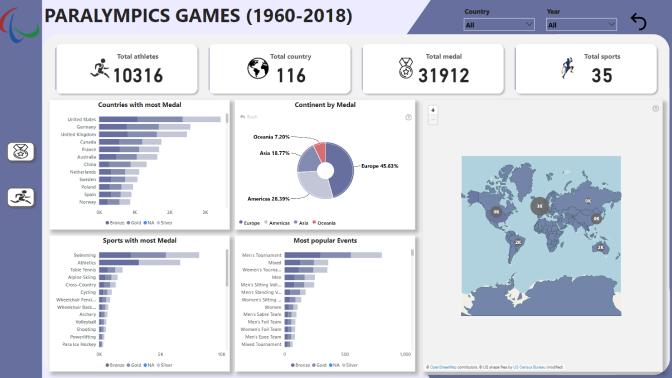
Report submitted for Onyx Data DataDNA ZoomCharts Mini Challenge, September 2024. The report was built based on Paralympic Games dataset and includes ZoomCharts custom Drill Down PRO visuals for Power BI.
Author's description:
It's an honor to showcase my analytics expertise using Power BI in this month's Onyx Data Challenge, in collaboration with Zoomchart.
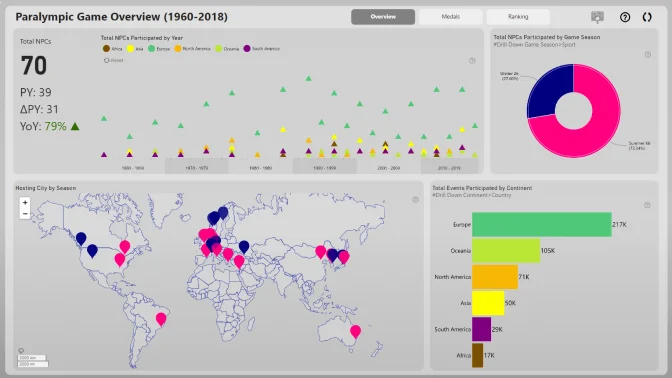
For this project, I dove into the world of Sports, specifically exploring the Paralympics, with a focus on aspects concerning people with disabilities. Using a comprehensive dataset spanning 1960-2018, I analyzed the history of Paralympic Games, including athlete records.
My analysis consists of three pages:
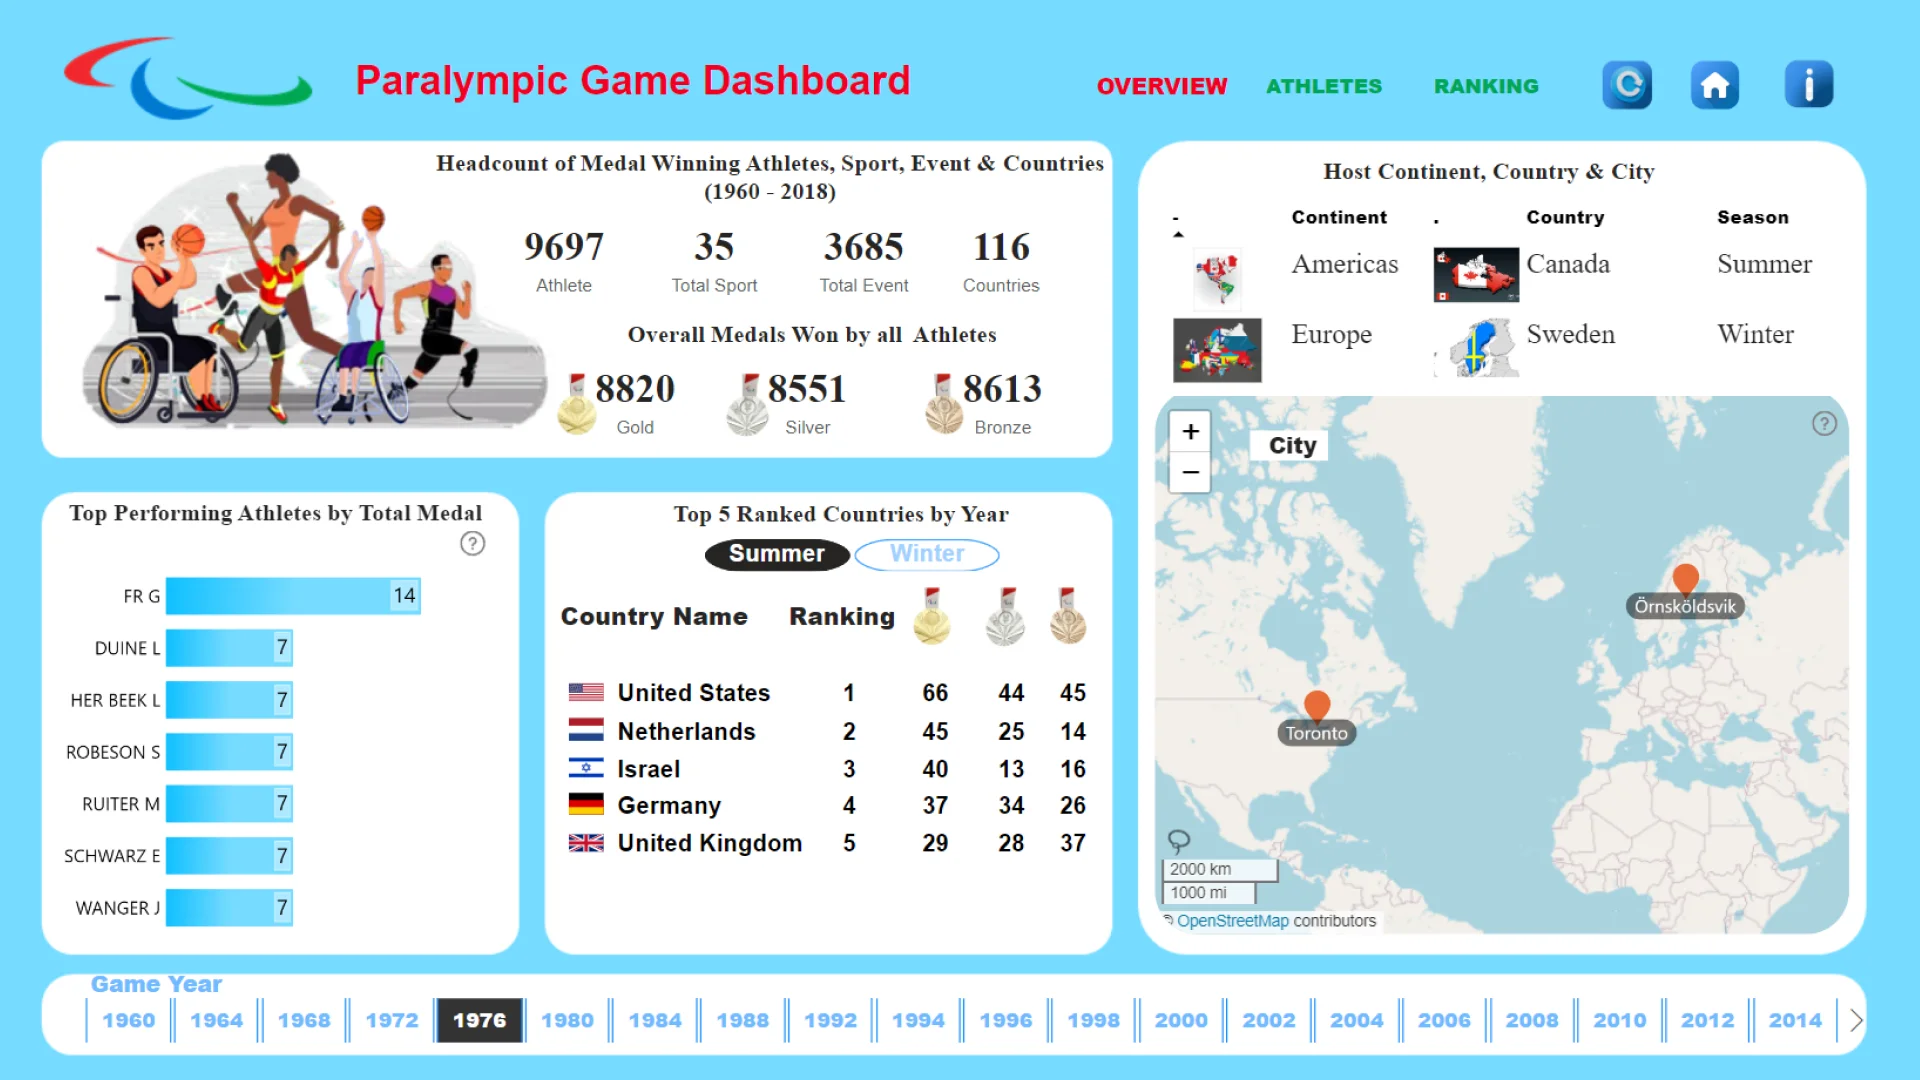
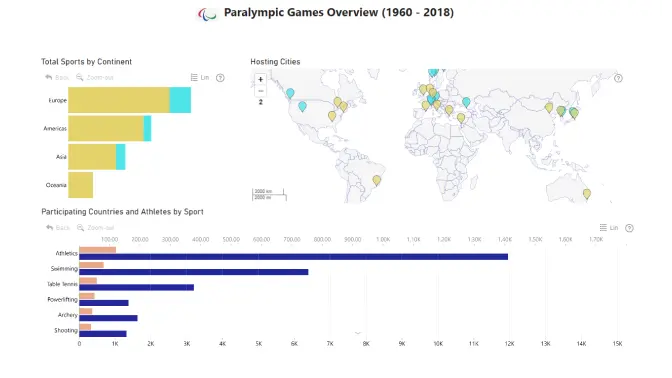
1. Overview Page: A summary and overview of the analysis, providing context and key insights.
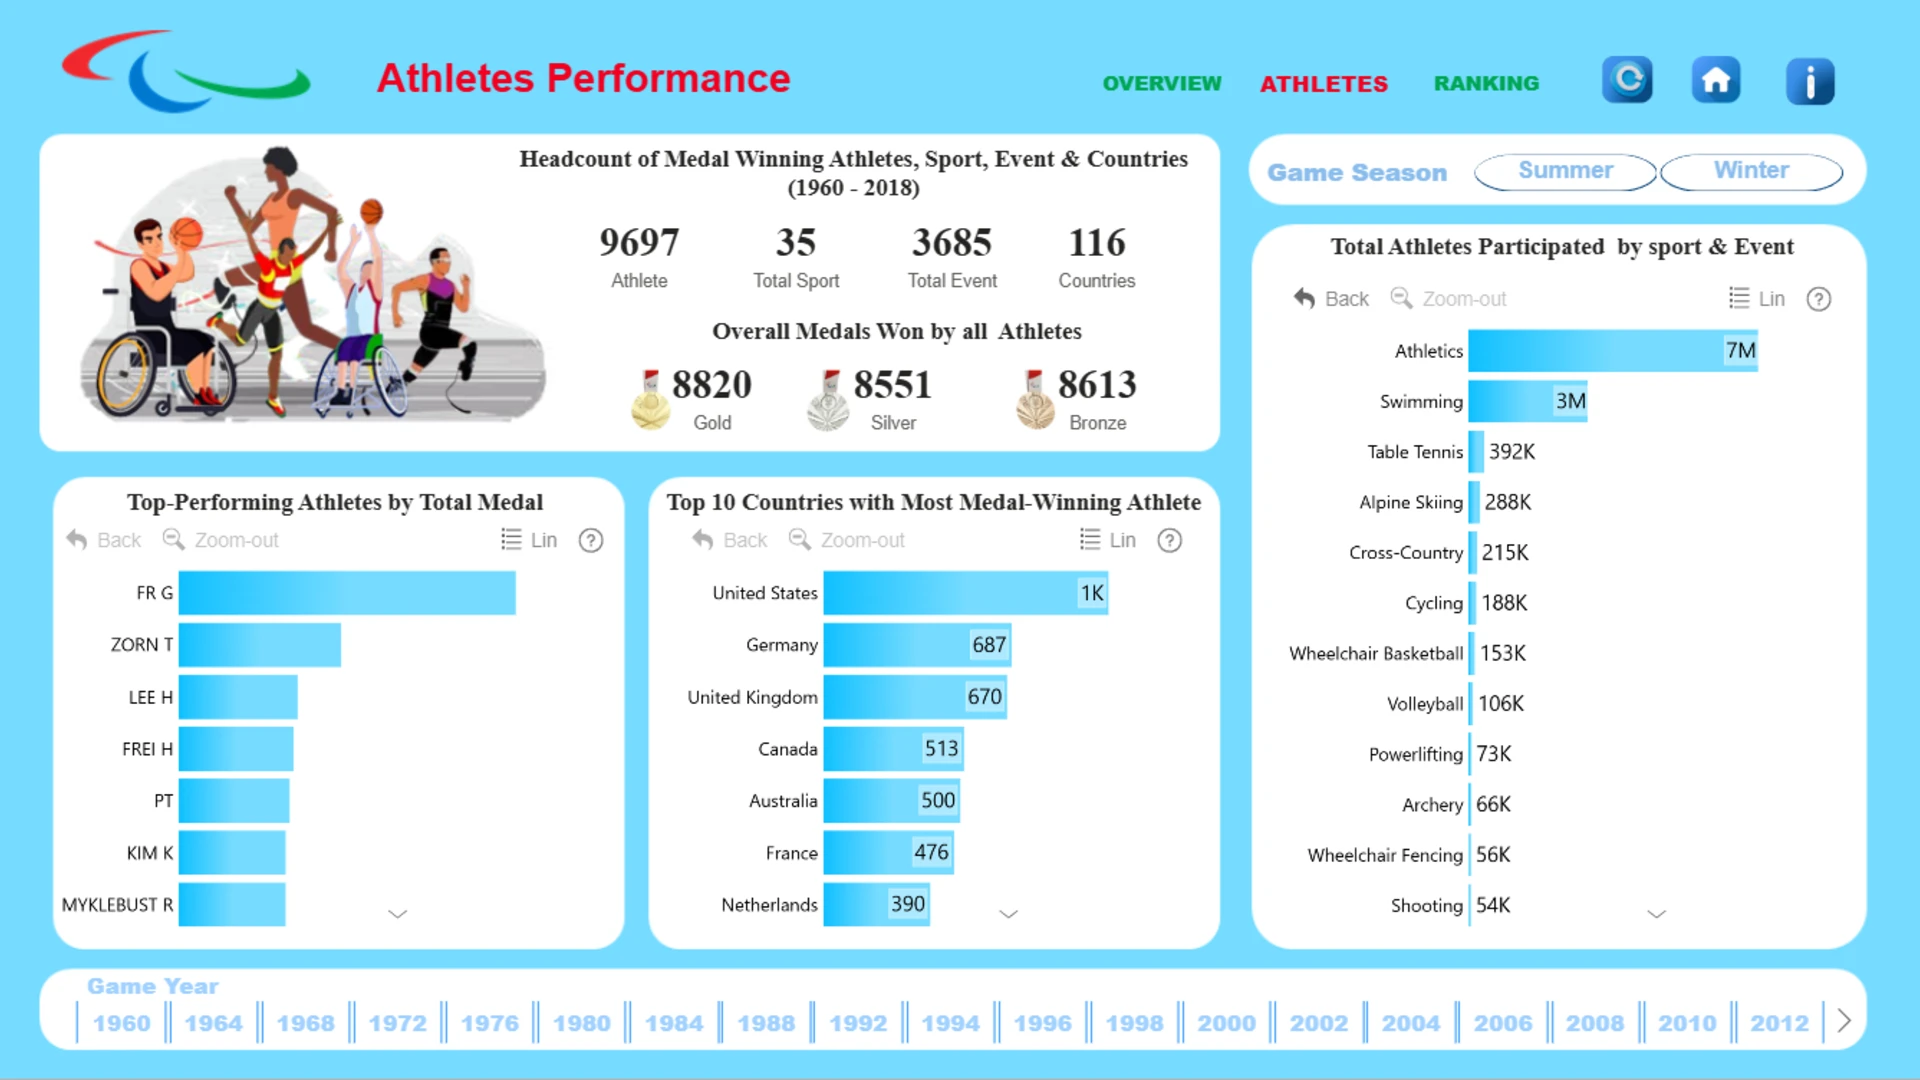
2. Athletes Performance Page: A deep dive into athletes' performance during the games, highlighting achievements and trends.
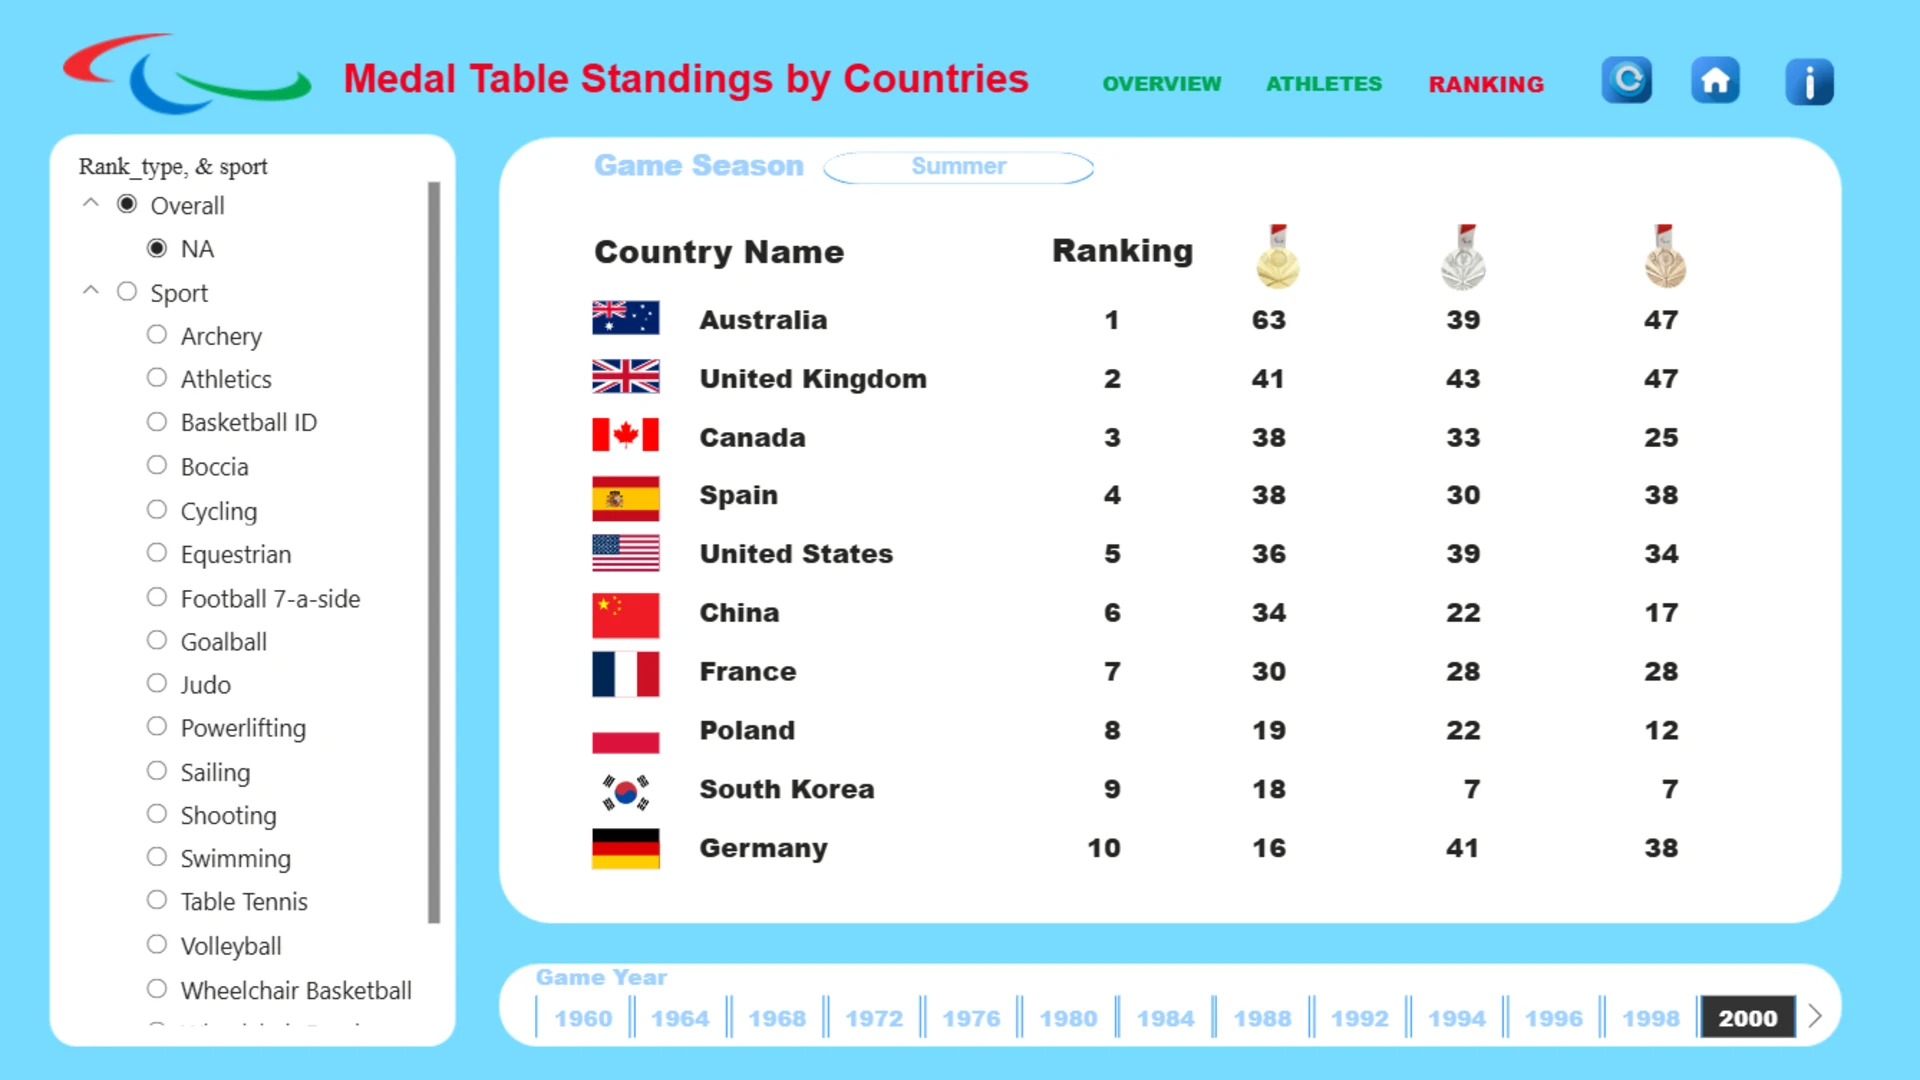
3. Ranking Page: A country-by-country ranking based on the medal table, showcasing national performance and competitiveness.
Through this visualization, I aim to provide valuable insights into the Paralympic Games, promoting awareness and appreciation for athletes with disabilities.
4U Report Challenges
Participate in data challenges, build and submit reports to get free template downloads.
Join CommunityMobile view allows you to interact with the report. To Download the template please switch to desktop view.
Was this helpful? Thank you for your feedback!
Sorry about that.
How can we improve it?