827
ONYX ZoomCharts Merchandise Sales Analysis Power BI Challenge
ONYX ZoomCharts Merchandise Sales Analysis Power BI Challenge
Report Author: Nadim Abou-Khalil
827
Share template with others
Report submitted for Onyx Data DataDNA ZoomCharts Mini Challenge, January 2025. The report is based on the Merchandise Sales dataset and includes ZoomCharts custom Drill Down PRO visuals for Power BI.
Author's description:
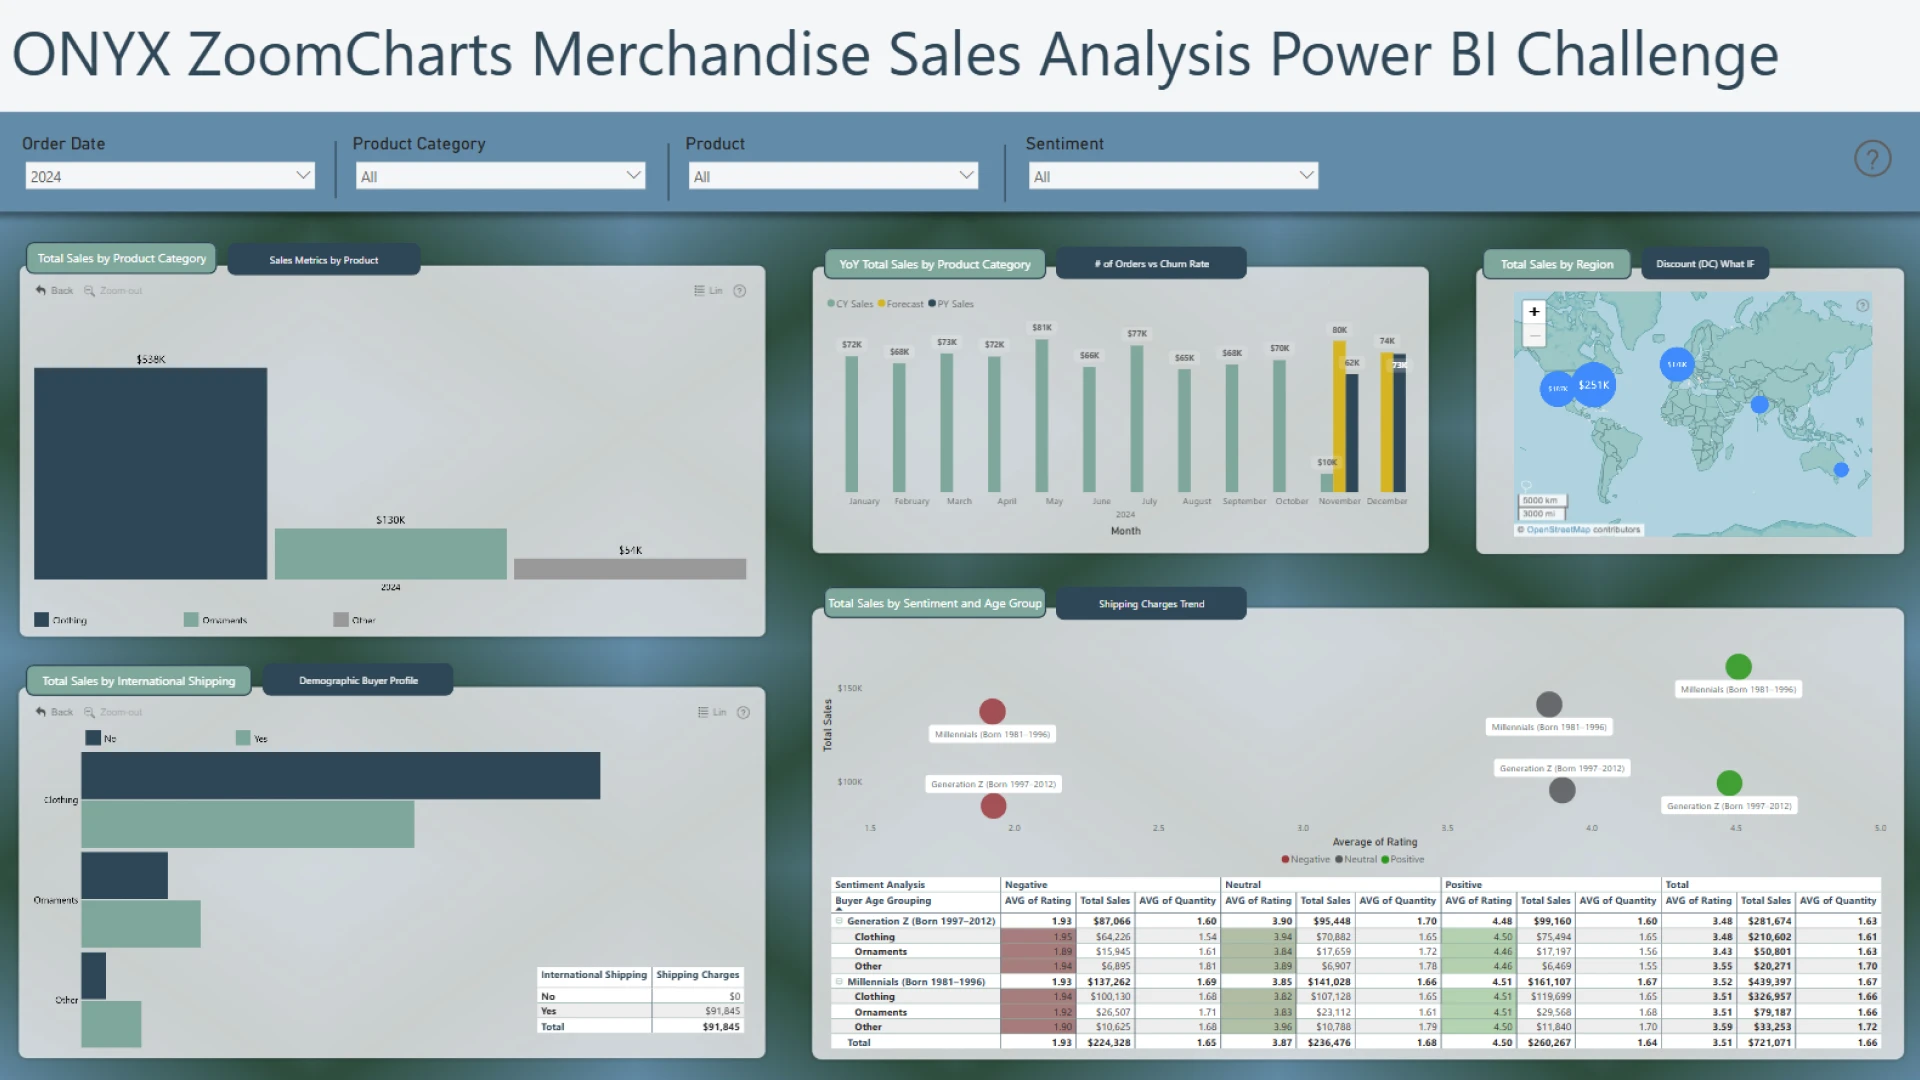
This Power BI report offers a comprehensive analysis of Lee Chatmen's merchandise business performance since its launch in 2023. Designed for interactivity, the dashboard features independently clickable sections, enabling users to explore multiple business aspects simultaneously.
To enhance usability, a navigation guide is included to help viewers interact seamlessly with various report elements.
Key Features:
- Sales Performance: Metrics and trends analysis to monitor overall business growth.
- Product Insights: Performance tracking by category and individual items.
- Geographic Distribution: Analysis of regional sales distribution and the impact of shipping.
- Customer Demographics: Insights into buyer profiles and purchase patterns.
- Ratings & Reviews: Evaluation of product feedback and customer satisfaction.
- Dynamic Shipping Costs: Tools for analyzing shipping charges over time.
- "What-If" Scenarios: A simulation tool to assess the impact of discounts on sales performance.
This interactive report is an invaluable tool for uncovering actionable insights and driving data-informed decisions.
4U Report Challenges
Participate in data challenges, build and submit reports to get free template downloads.
Join CommunityMobile view allows you to interact with the report. To Download the template please switch to desktop view.

Was this helpful? Thank you for your feedback!
Sorry about that.
How can we improve it?