logo
For Power BI
  • Products
    • Custom Visuals for Power BI
    • Report Templates
  • Resources

      Resources

    • Documentation
    • Report Examples
    • Blog
    • Webinars
    • Video Tutorials
    • Visuals Gallery

    Support

    • ZoomCharts Assistance
    • Contact Sales
    • Contact Support
    • FAQ

    Challenges

    Challenges

    Improve your report creation skills by participating in free challenges for report creators.

    Learn more
    Get Developer License
  • Services
    • Power BI Report Development
    • Custom Visual Development
  • Challenges
  • Pricing
    • Custom Visuals for Power BI
    • Report Templates
Subscribe
Subscribe
Get it now
Go back

Contents

Contest logo
Contest logo
Contest logo
Contest logo
Try Free Now
Go back

Onyx Data June 2024 Challenge

Report Author: Balu Chelluri

222

Onyx Marketing Campaign Analysis

Report
Report Interact

Combo Donut Sales Marketing

Share template with others

Report submitted for OnyxData and ZoomCharts Challenge June 2024. The report was built with the Marketing Campaing Datase and includes ZoomCharts custom Drill Down PRO visuals for Power BI.

Author's description:

Financial KPIs:

  • Spend: Total amount of money spent on advertising or campaigns.
  • Total Conversion Value: Total monetary value generated from conversions.
  • Profit: Difference between Total Conversion Value and Spend.
  • ROI (Return on Investment): Ratio of Profit to Spend, indicating efficiency and profitability.

Digital KPIs:

  • Impressions: Number of times an ad is displayed or seen by users.
  • Clicks: Number of times users click on an ad.
  • CTR (Click-Through Rate): Percentage of users who click on an ad after seeing it.
  • CPC (Cost-Per-Click): Average cost incurred for each click on an ad.
  • ERI (Engagement Rate by Impressions): Percentage of impressions that result in engagement (comments, likes, shares, etc.).

Performance/Effectiveness KPIs:

  • Clicks to Conversion (CTC): Ratio of clicks to conversions, measuring conversion efficiency.
  • Conversions: Number of desired actions completed by users, such as purchases or sign-ups.

This report contains two pages:

KPI View:

  • Tracks KPI performance across periods with a comparison of the latest month to the previous month to identify underperforming KPIs.
  • Analyzes KPIs by social media channels to optimize campaign effectiveness and identify high-traffic areas.
  • Compares financial and digital KPIs across different geographical locations.
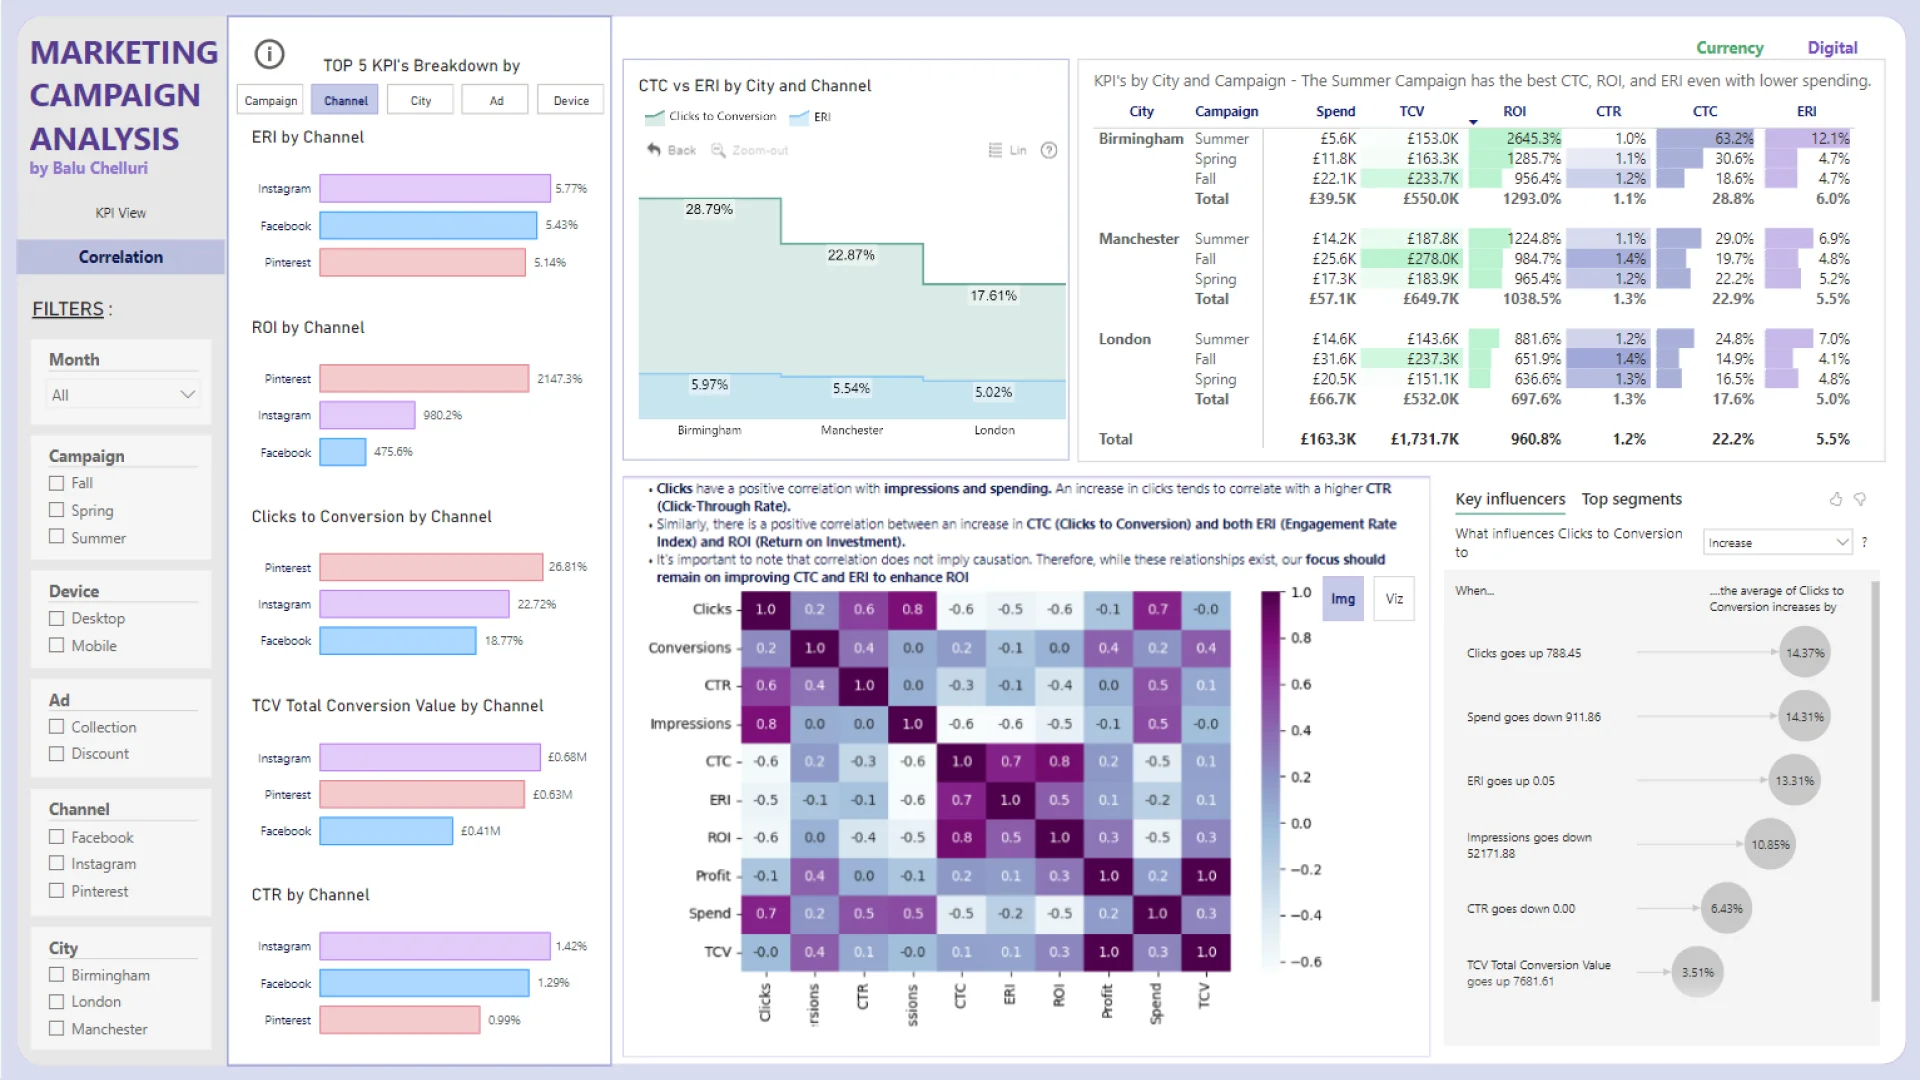
Correlation Page:

  • Provides top KPI comparisons across categories and assesses campaign performance in each city.
  • Identifies influencers affecting Clicks to Conversion (CTC) for improved ROI and ERI.
  • Examines correlations among different KPIs.

Key Findings Include:

  • Fall campaigns perform best, possibly due to seasonal markets.
  • Summer campaigns excel in CTC, ROI, and ERI despite lower spending.
  • Collection ads show high engagement but lack value; discount-based ads lead in CTC.
  • Mobile drives higher impressions; desktops have better CTR and CTC.
  • Instagram leads in engagement; Pinterest tops in profit and CTC in Birmingham and Manchester.
  • Despite London's high population, it shows lower CTC but higher CTR, while Birmingham leads in ROI and ERI.

ZoomCharts visuals used

Drill Down Donut PRO (Pin) Drill Down Donut PRO (Pin)
Drill Down Combo PRO Drill Down Combo PRO

Need help?

Send your question to ZoomCharts assistant, and we will respond to you as soon as possible.

Contact Us

Mobile view allows you to interact with the report. To Download the template please switch to desktop view.

Report Overhaul

ZoomCharts Academy

Learn ZoomCharts with experts and become certified!

Go to Academy!
Report Overhaul

Was this helpful? Thank you for your feedback!

Sorry about that.

How can we improve it?

Onyx Marketing Campaign Analysis

Share

ZoomCharts

Welcome to ZoomCharts

You’re almost there! Create an account to keep your saved reports.

or
Sign up with Microsoft

Verify your email address

We have sent a code to your email address. Please input the code below.

Didn't receive code? Request again (after 30 seconds)

Already have an account? Log in

ZoomCharts

Log in to your ZoomCharts account

Log in with Microsoft
or
Forgot password?

Reset your password

We'll email you instructions on how to reset your password

Don't have an account? Sign up

Please add credits

You have 0 available downloads.
Get more credits or upgrade your plan to continue.

View pricing
logo
[email protected]
+44 204 577 3993
logo

Products

Drill Down Network PRO Drill Down Waterfall PRO Drill Down Graph PRO Drill Down Combo PRO Drill Down Combo Bar PRO Drill Down Donut PRO Drill Down Pie PRO Drill Down TimeSeries PRO Drill Down Timeline PRO Drill Down Map PRO Drill Down Scatter PRO All Visuals

Resources

Report Examples Webinars Blog ZoomCharts Academy Visuals Gallery Documentation Custom Visual Development Subscribe to News

Solutions

Custom Visual Development

Company

Pricing About Us Partners Leave feedback Join PowerGroup EU Funding

Help

ZoomCharts Assistance Contact Sales Contact Support FAQ

Drill Down Network PRO Drill Down Waterfall PRO Drill Down Graph PRO Drill Down Combo PRO Drill Down Combo Bar PRO Drill Down Donut PRO Drill Down Pie PRO Drill Down TimeSeries PRO Drill Down Timeline PRO Drill Down Map PRO Drill Down Scatter PRO All Visuals

Report Examples Webinars Blog ZoomCharts Academy Visuals Gallery Documentation Custom Visual Development Subscribe to News

Custom Visual Development

Pricing About Us Partners Leave feedback Join PowerGroup EU Funding

ZoomCharts Assistance Contact Sales Contact Support FAQ
+44 204 577 3993
[email protected]

Ready to get in touch?

Contact our experts with any question about Power BI and ZoomCharts for Free!

Contact us

© 2025, Data Visualization Software Lab

U.S. Patents No. 11,645,343; 11,921,804; 12,346,389

Cookies
Privacy Policy
Global
Legal
Patent
warning

Error message

success

Success info: Done!

ZoomCharts AI Assistant

We noticed you're using an old OS version.

For the best experience, we recommend upgrading to ensure that all website features display correctly.

Cookie settings

We use necessary cookies for site functionality, as well as statistic, marketing, and preference cookies to enhance your experience. For more information and to manage your preferences, please visit our Cookie policy