2678
Store Marketing Campaign Performance Dashboard
Store Marketing Campaign Performance Dashboard
More Report pages
Report Author: Phùng Trí Hải
2678
Share template with others
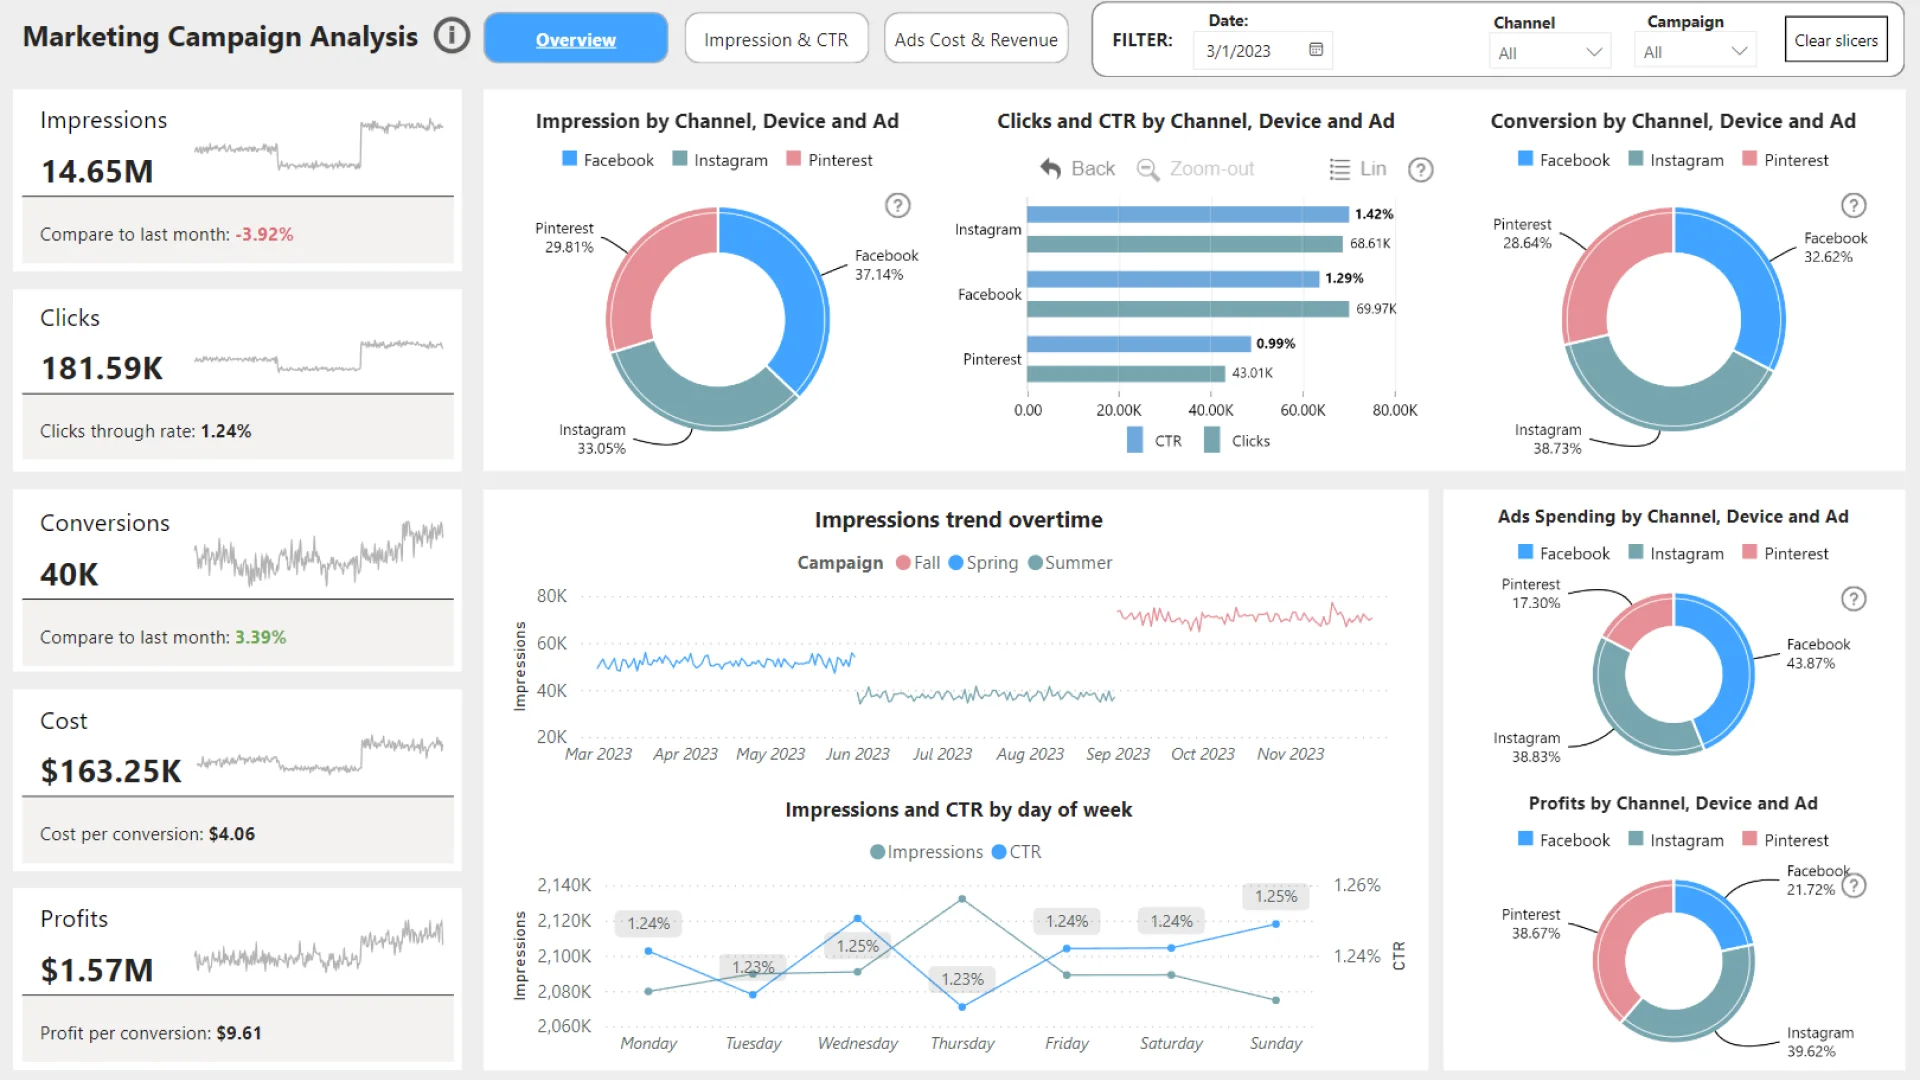
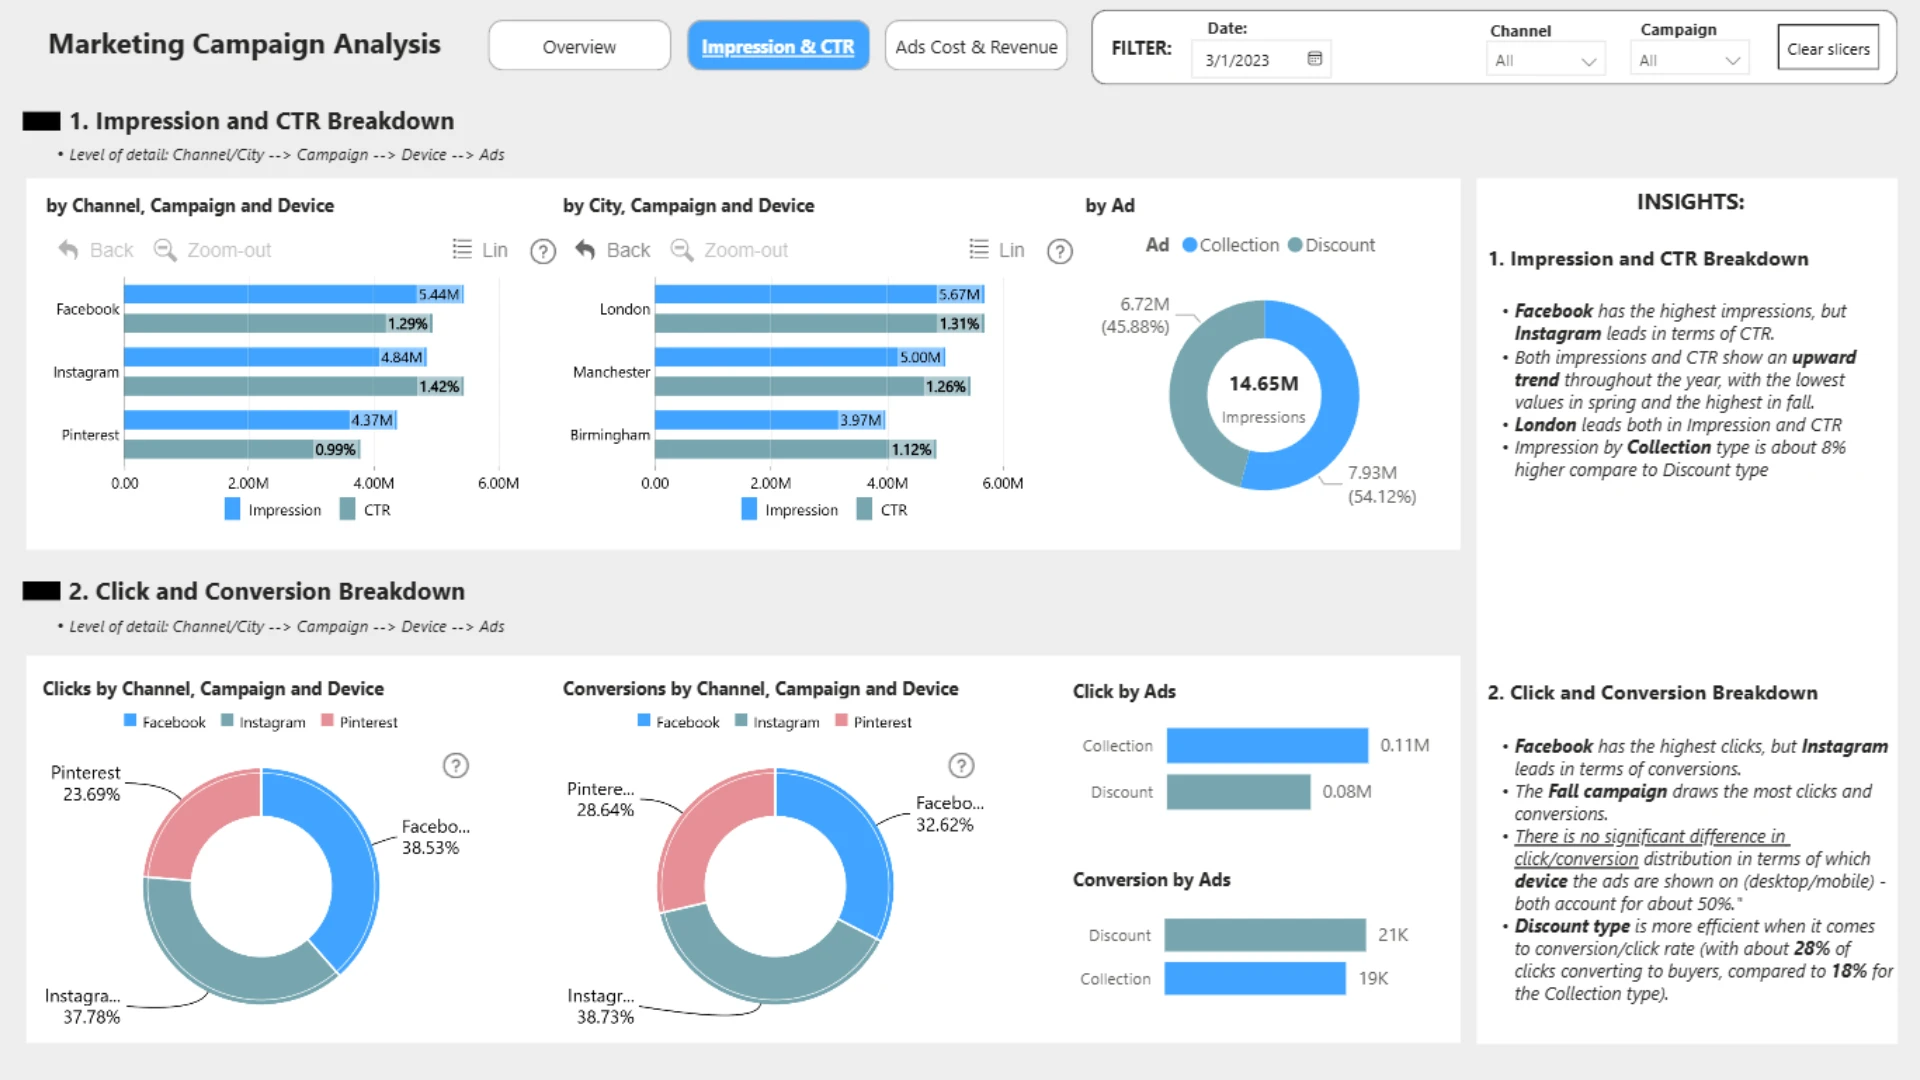
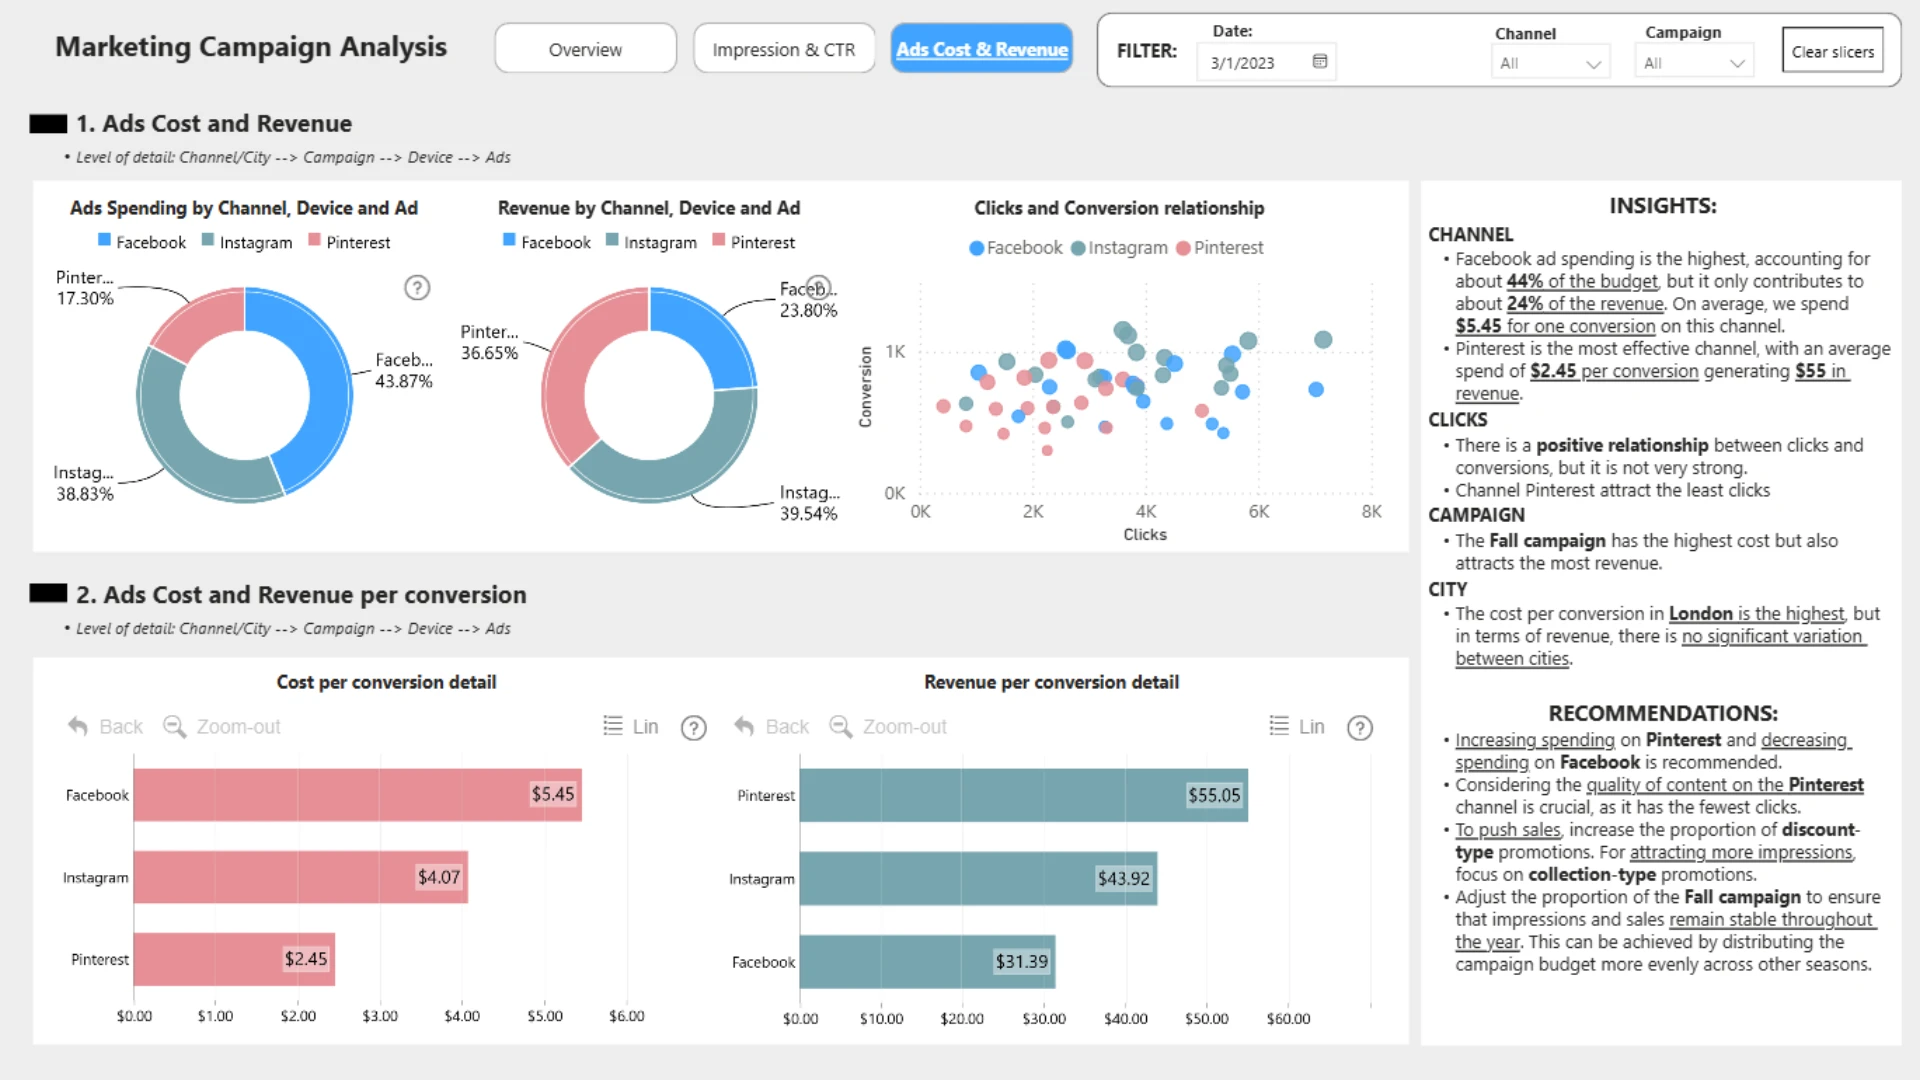
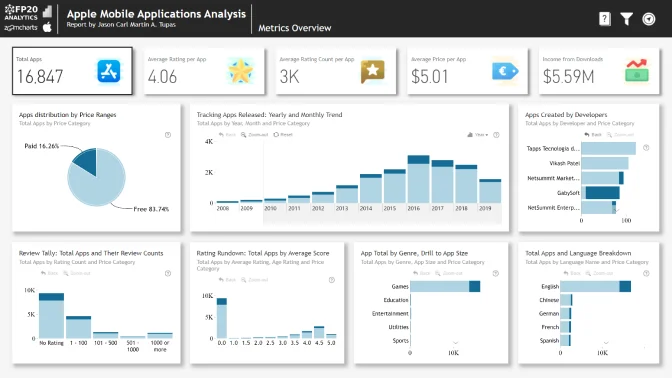
Explore a Power BI marketing campaign performance dashboard built for analyzing seasonal campaigns for a UK clothing store. This report helps marketers compare campaign results across cities, social media channels, devices, and ad types while tracking key metrics such as impressions, CTR, clicks, CPC, spend, conversions, conversion value, likes, shares, and comments.
Author's description:
A UK-based clothing store launched targeted marketing campaigns for the Spring, Fall, and Summer seasons. Each campaign included two distinct advertisements on Facebook, Pinterest, and Instagram: one highlighting discounts and the other showcasing the latest clothing collections. The campaigns focused specifically on three major cities: London, Birmingham, and Manchester. Daily performance metrics were meticulously captured across various dimensions, including cities, channels, devices, and individual ads. These metrics encompassed Impressions, Click-Through Rate (CTR), Clicks, Daily Average Cost-Per-Click (CPC), Spend, Conversions, Total Conversion Value, Likes, Shares, and Comments.
4U Report Challenges
Participate in data challenges, build and submit reports to get free template downloads.
Join CommunityMobile view allows you to interact with the report. To Download the template please switch to desktop view.
Was this helpful? Thank you for your feedback!
Sorry about that.
How can we improve it?