813
Marketing Campaign Performance Analysis
Marketing Campaign Performance Analysis
Report Author: Ugochukwu Nwasuruba
813
Share template with others
Report submitted for OnyxData #DataDNA and ZoomCharts Challenge June 2024. The report was built with the Marketing Campaing Dataset and includes ZoomCharts custom Drill Down PRO visuals for Power BI.
Author's description:
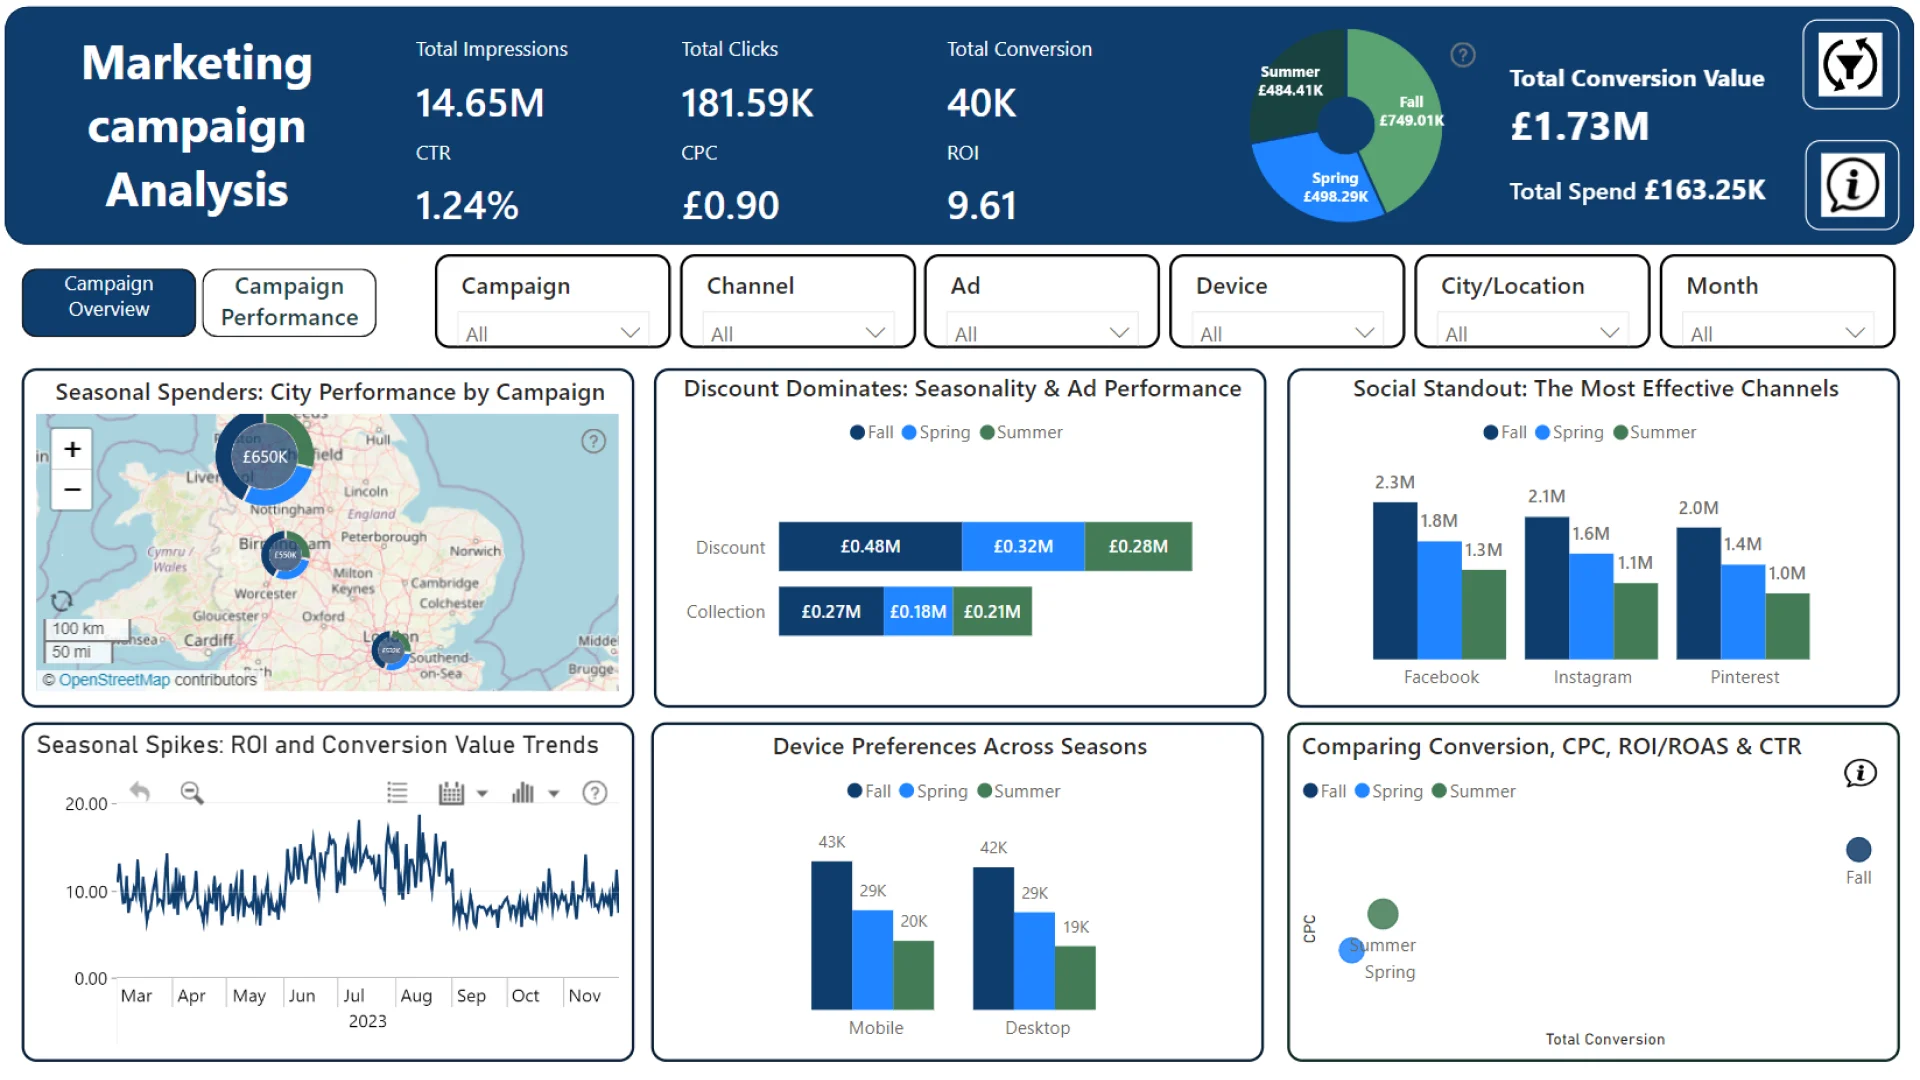
This analysis is for a UK-based clothing store that launched targeted marketing campaigns for the Spring, Fall, and Summer seasons. Each campaign included two distinct advertisements on Facebook, Pinterest, and Instagram: one highlighting discounts and the other showcasing the latest clothing collections. The campaigns specifically targeted three major cities: London, Birmingham, and Manchester.
Key Insights:
-
Campaign Seasons:
- Fall campaign is the most expensive but generates the highest conversion value.
- Summer campaign, despite the lowest spend, shows a competitive conversion value.
- Spring campaign provides a balance between spend and conversion value.
-
Ad Types:
- Discount ads generate higher conversion value and higher ROI/ROAS, indicating more effective performance.
- Collection ads have a higher CPC but lower CTR compared to discount ads.
-
Channels:
- Pinterest shows the highest conversion value with the lowest spend, indicating strong efficiency.
- Facebook, despite the highest spend, has the lowest conversion value.
- Instagram has moderate spend and conversion value, but a high CPC and CTR.
Recommendations:
- Focus on Summer Campaigns: They provide good conversion value with lower spend.
- Leverage Discount Ads: They are more effective in generating higher ROI and ROAS.
- Optimize Spend on Pinterest: Given its high conversion value with lower spend, investing more in Pinterest could yield better returns.
- Reassess Facebook Strategy: With high spend but low conversion value, Facebook campaigns might need optimization or reallocation of the budget to more effective channels like Pinterest or Instagram.
ZoomCharts visuals used
4U Report Challenges
Participate in data challenges, build and submit reports to get free template downloads.
Join CommunityMobile view allows you to interact with the report. To Download the template please switch to desktop view.


Was this helpful? Thank you for your feedback!
Sorry about that.
How can we improve it?