168434
Marketing Campaign Analysis Power BI Report
Marketing Campaign Analysis Power BI Report
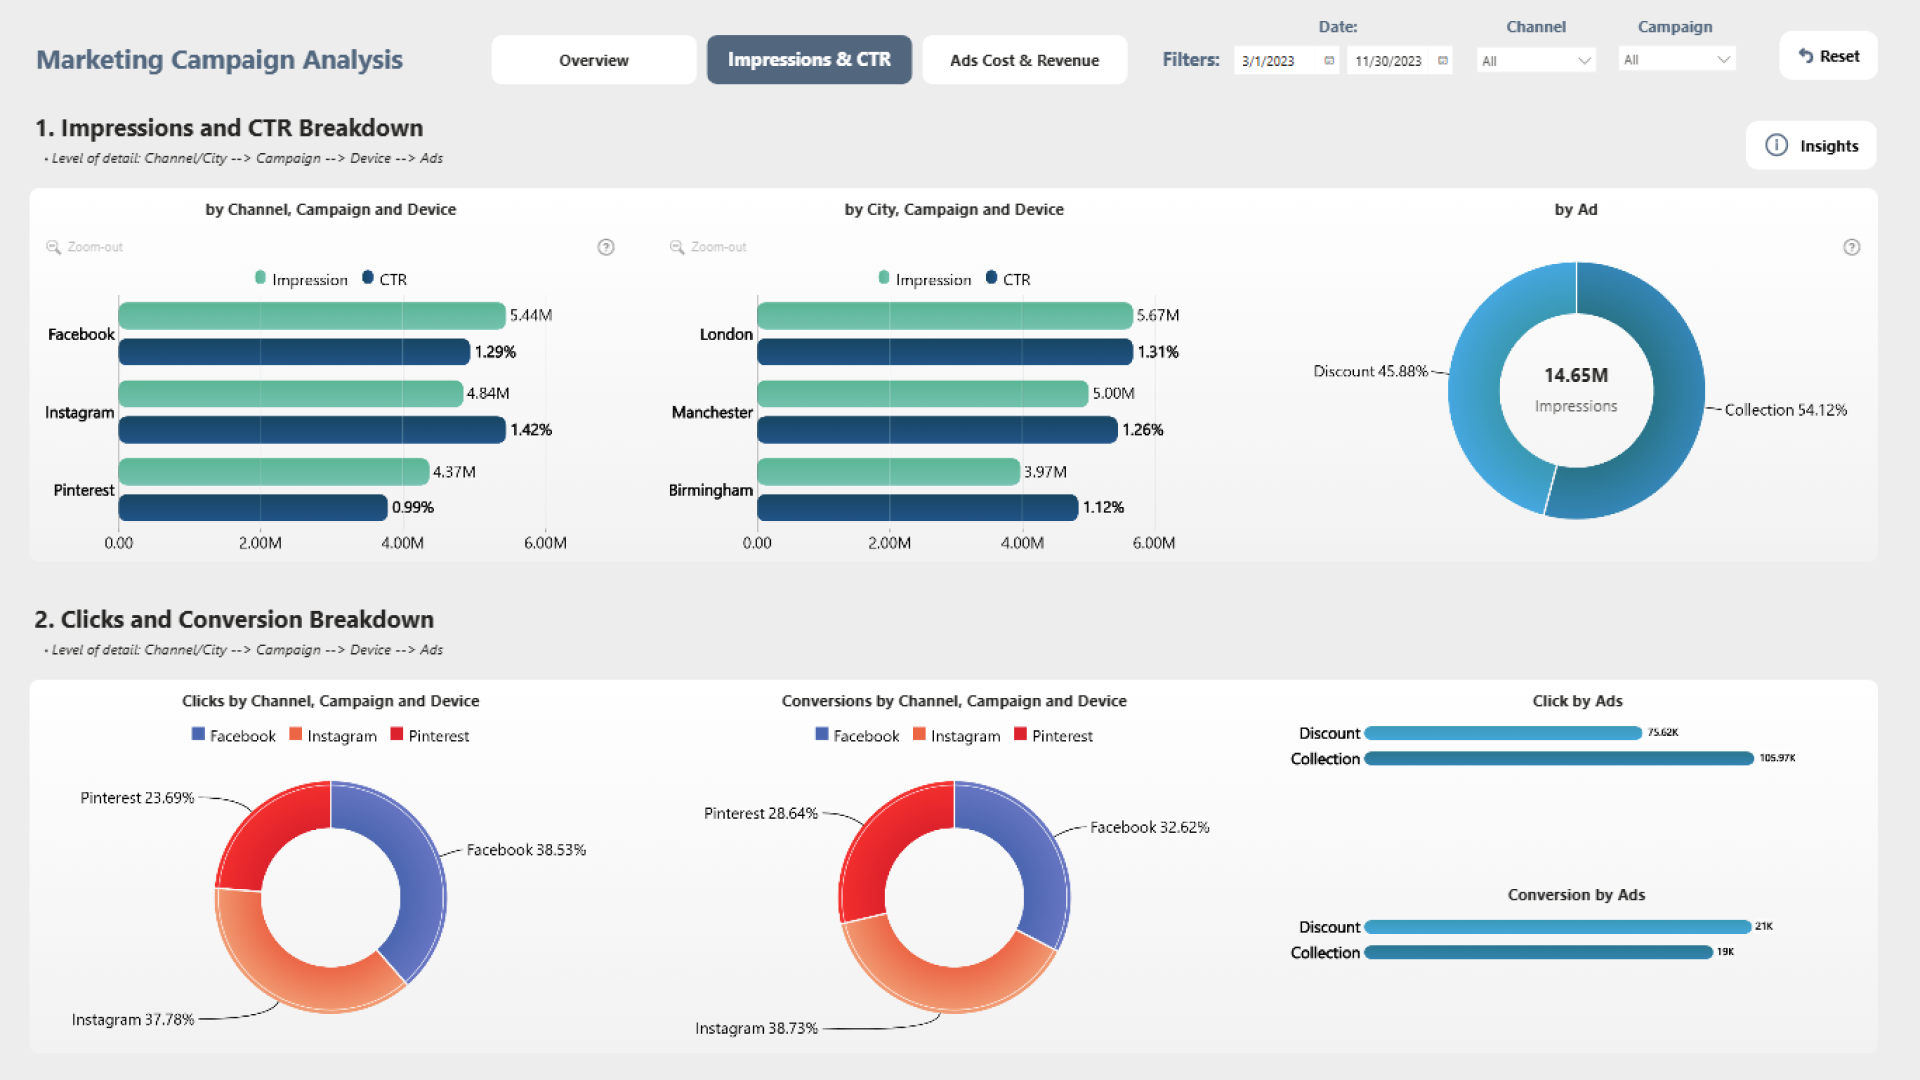
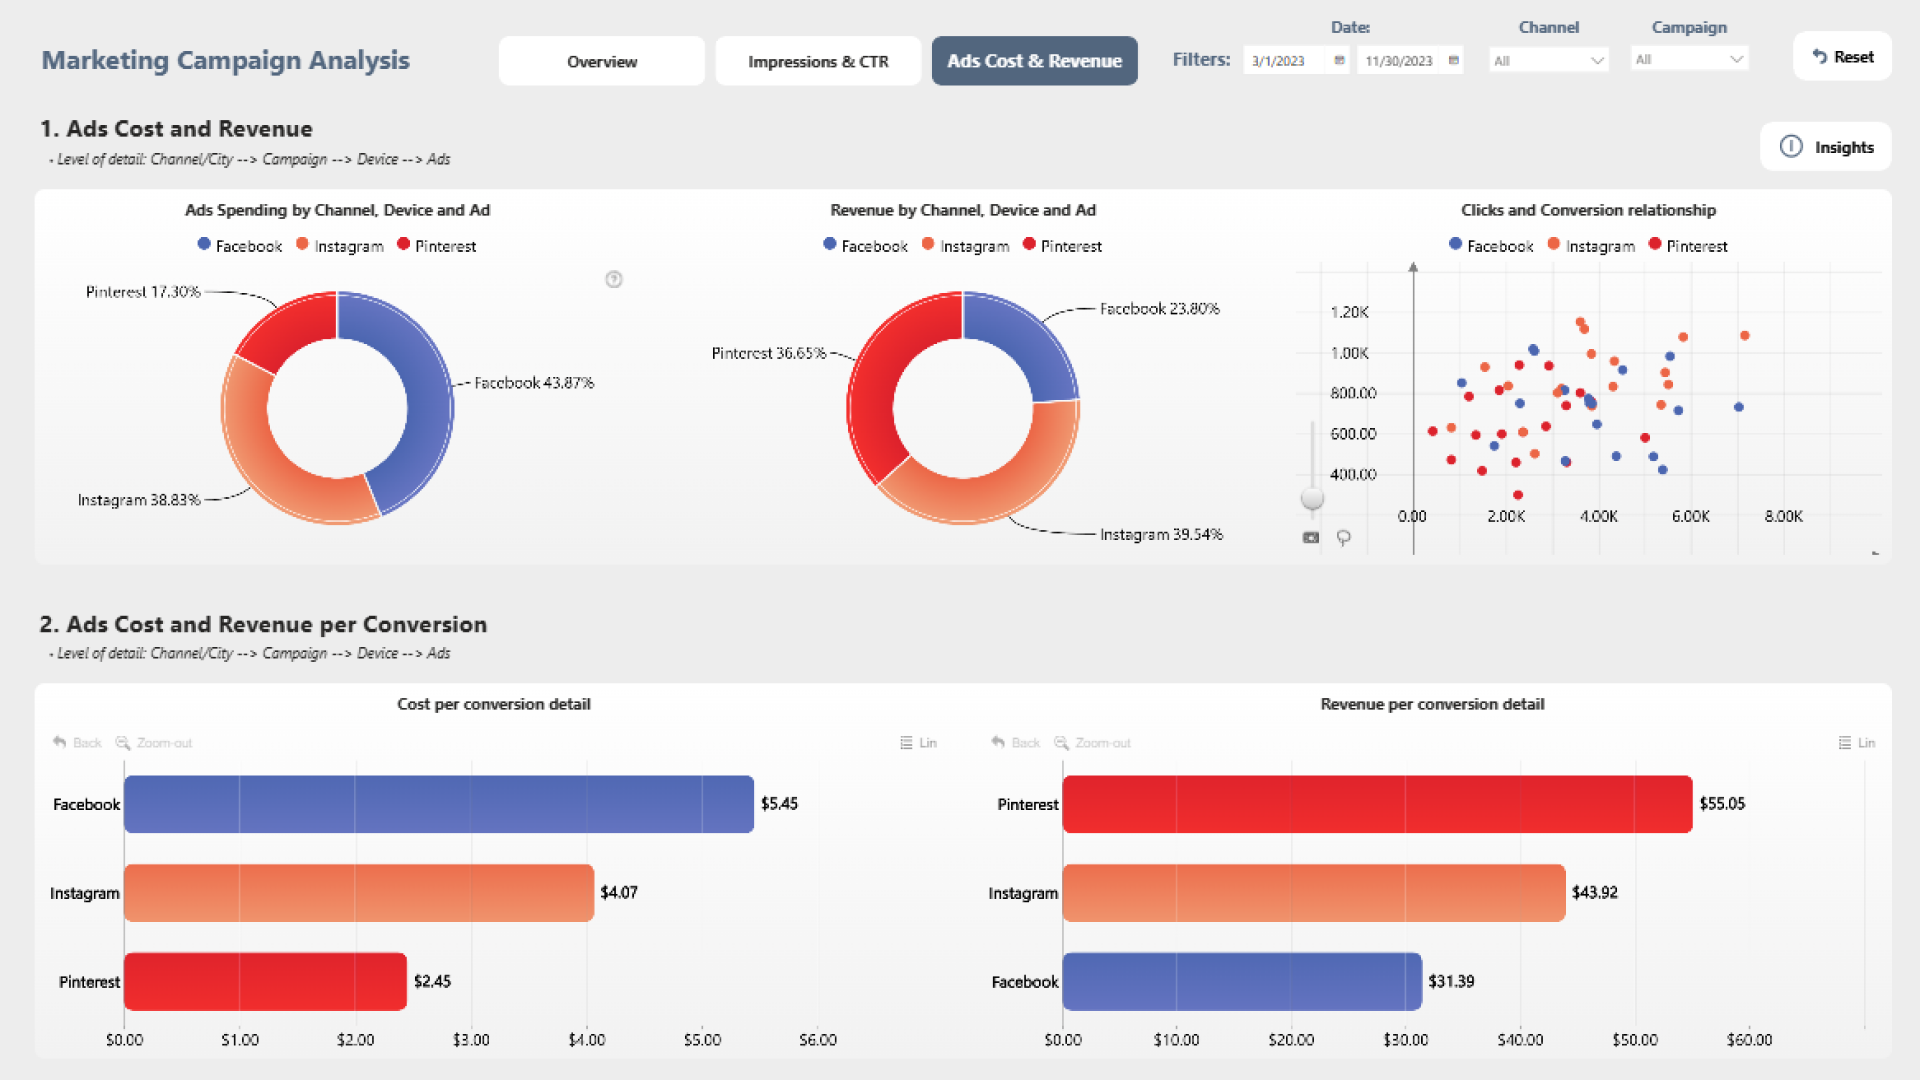
More Report pages
Overhauled by ZoomCharts
168434
Share template with others
Summary
This Power BI marketing campaign analysis report is the winning entry for ZoomCharts Mini Challenge which was hosted as a part of the Onyx Data June 2024 Challenge.
It analyzes two distinct advertising campaigns on Facebook, Pinterest and Instagram for a fashion brand to gain insights on what message performs the best – discounts or latest clothing collections.
Key Insights of This Report
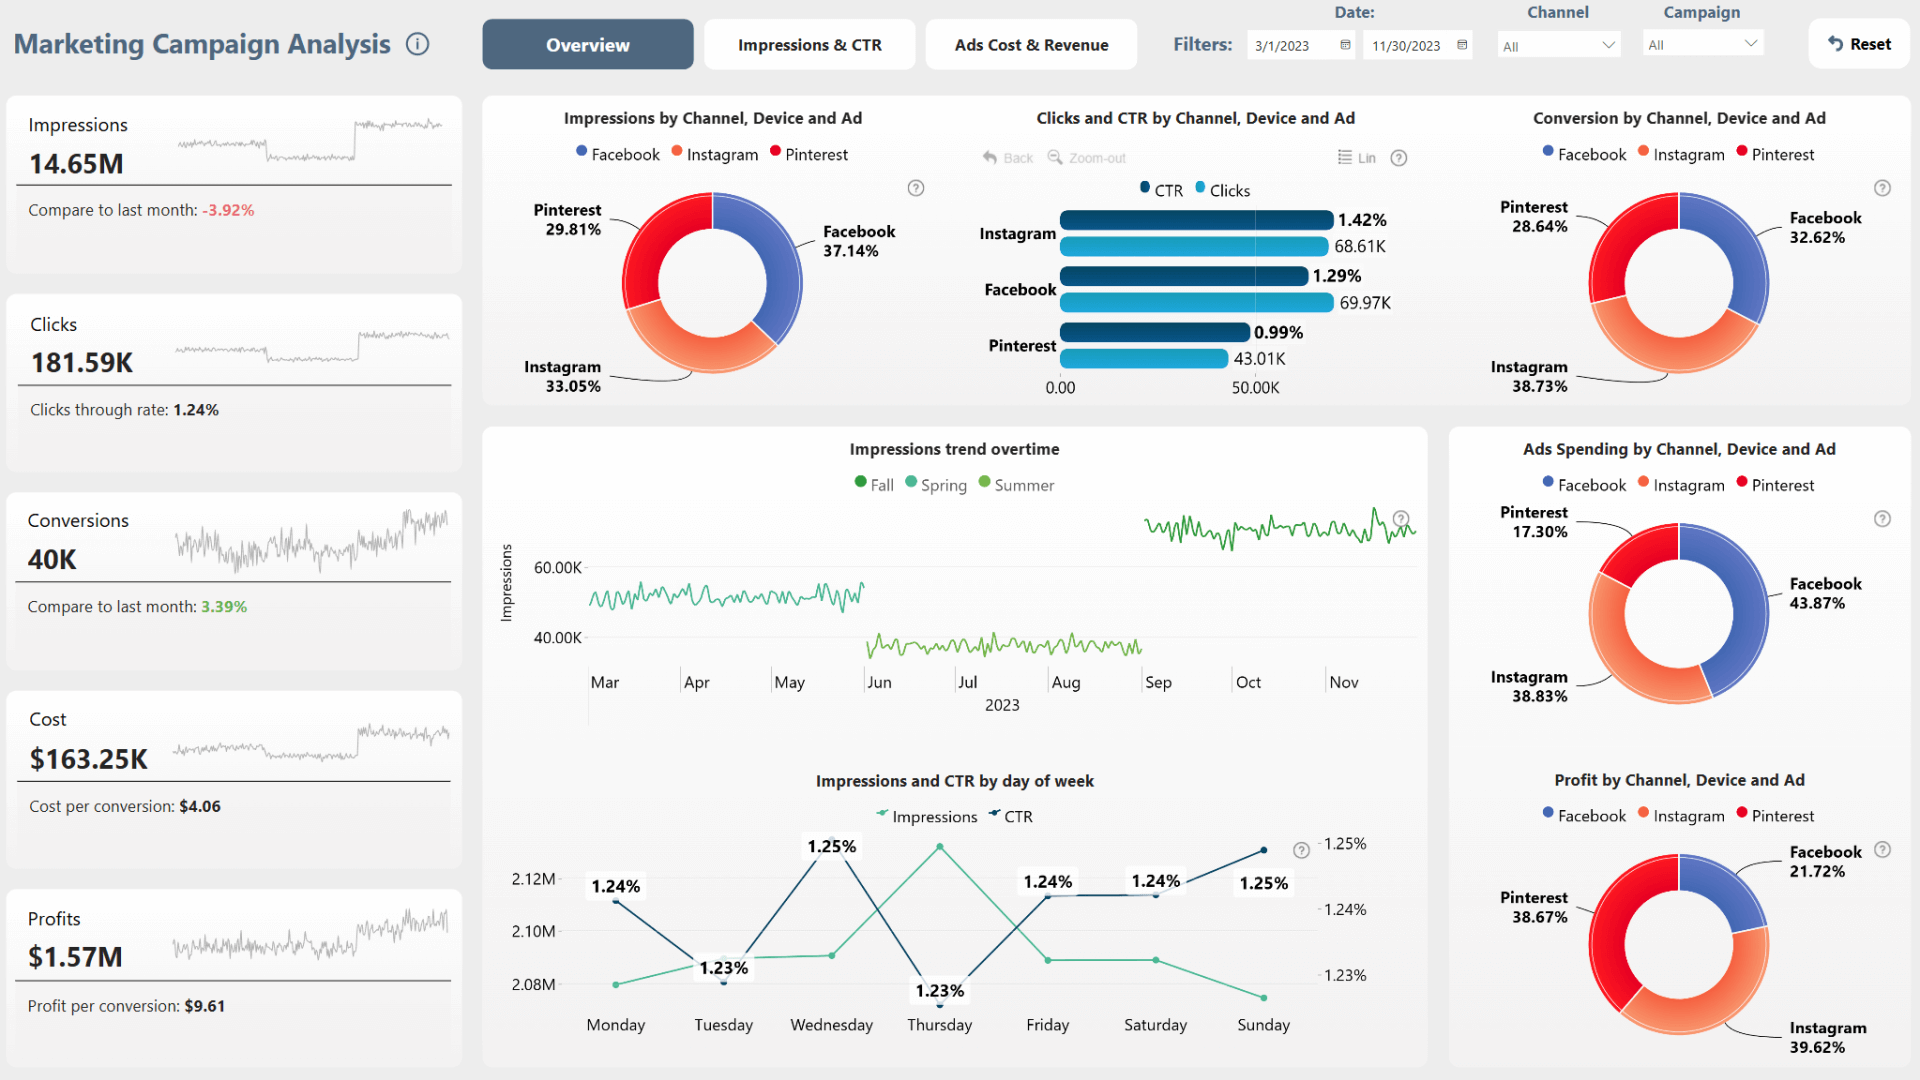
This report displays various metrics from two targeted marketing campaigns in three cities (London, Manchester, Birmingham), including:
- Impressions
- Clicks
- CTR
- Conversions
- Cost & cost-per-conversion
- Profit & profit-per-conversion
Each of these metrics can be filtered to a specific campaign, time period, channel, device type, and city. Simply select data in ZoomCharts interactive visuals and it will cross-filter other visuals to instantly reveal detailed insights.
The report is based on the challenge submission with minor refinements by the ZoomCharts team. See the original submission here.
How To Use This Report Template
To interact with this Power BI marketing campaign analysis report, simply click any active elements directly on the charts.
Download this report to see all the settings, formulas, and calculations. Try it out with your own data by making a few adjustments.
ZoomCharts visuals used





4U Report Challenges
Participate in data challenges, build and submit reports to get free template downloads.
Join CommunityMobile view allows you to interact with the report. To Download the template please switch to desktop view.
How to use a PBIX template
Preview the interactive report, download the PBIX file, open it in Power BI Desktop, and replace the same data connection with your own dataset.
Preview and download
Explore the report online and download the PBIX template file.
Open in Power BI Desktop
Open the downloaded PBIX file in Power BI Desktop.
Connect your data
Replace the sample data source with your own dataset.
Refresh and adjust
Refresh the model and update fields or visual were needed.
Save and share
Save your report and publish it for your audience.


