Feel free to leave your vote:
22
Share template with others
Summary
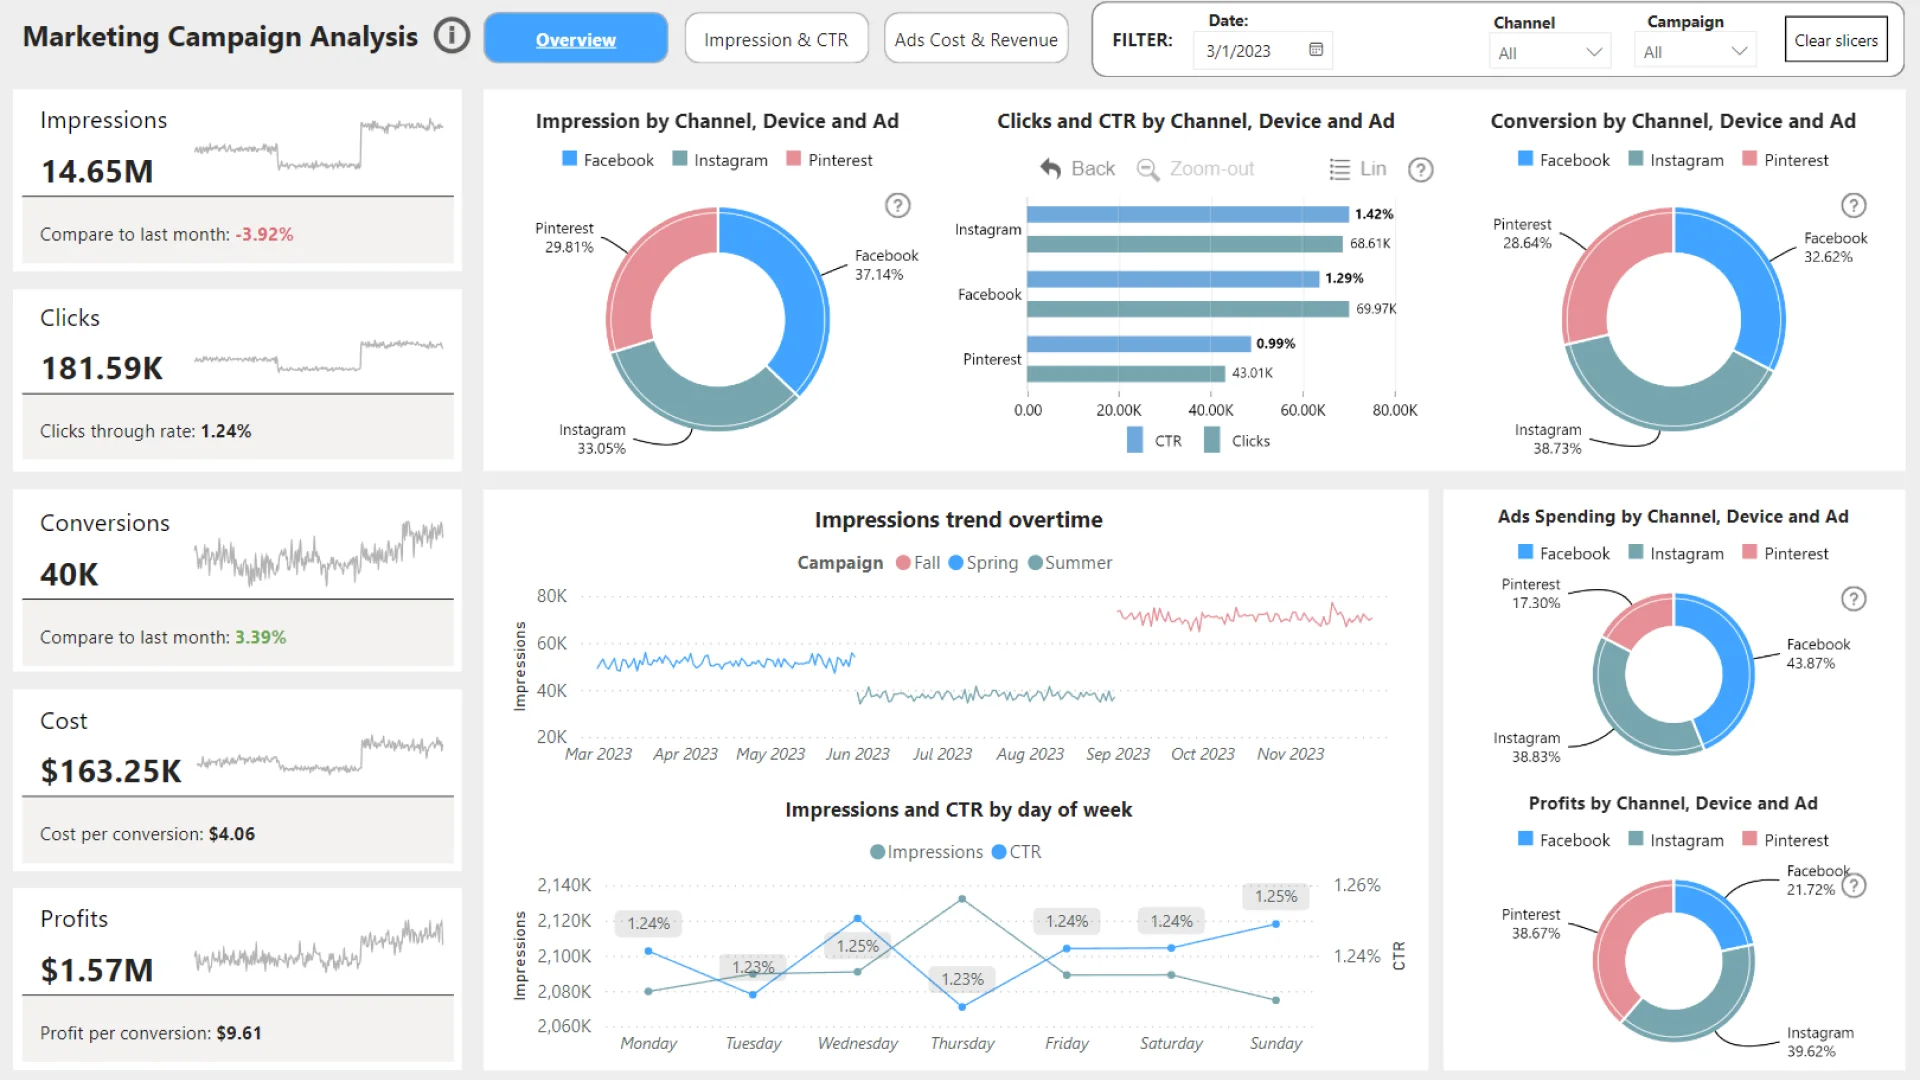
Report submitted for OnyxData #DataDNA and ZoomCharts Challenge June 2024. The report was built with the Marketing Campaing Dataset and includes ZoomCharts custom Drill Down PRO visuals for Power BI.
Author's description:
A UK-based clothing store launched targeted marketing campaigns for the Spring, Fall, and Summer seasons. Each campaign included two distinct advertisements on Facebook, Pinterest, and Instagram: one highlighting discounts and the other showcasing the latest clothing collections. The campaigns focused specifically on three major cities: London, Birmingham, and Manchester. Daily performance metrics were meticulously captured across various dimensions, including cities, channels, devices, and individual ads. These metrics encompassed Impressions, Click-Through Rate (CTR), Clicks, Daily Average Cost-Per-Click (CPC), Spend, Conversions, Total Conversion Value, Likes, Shares, and Comments.
Mobile view allows you to interact with the report. To Download the template please switch to desktop view.