1060
Marketing Campaign Performance Analysis Dashboard
Marketing Campaign Performance Analysis Dashboard
More Report pages
Report Author: Sweety Antoni David
1060
Share template with others
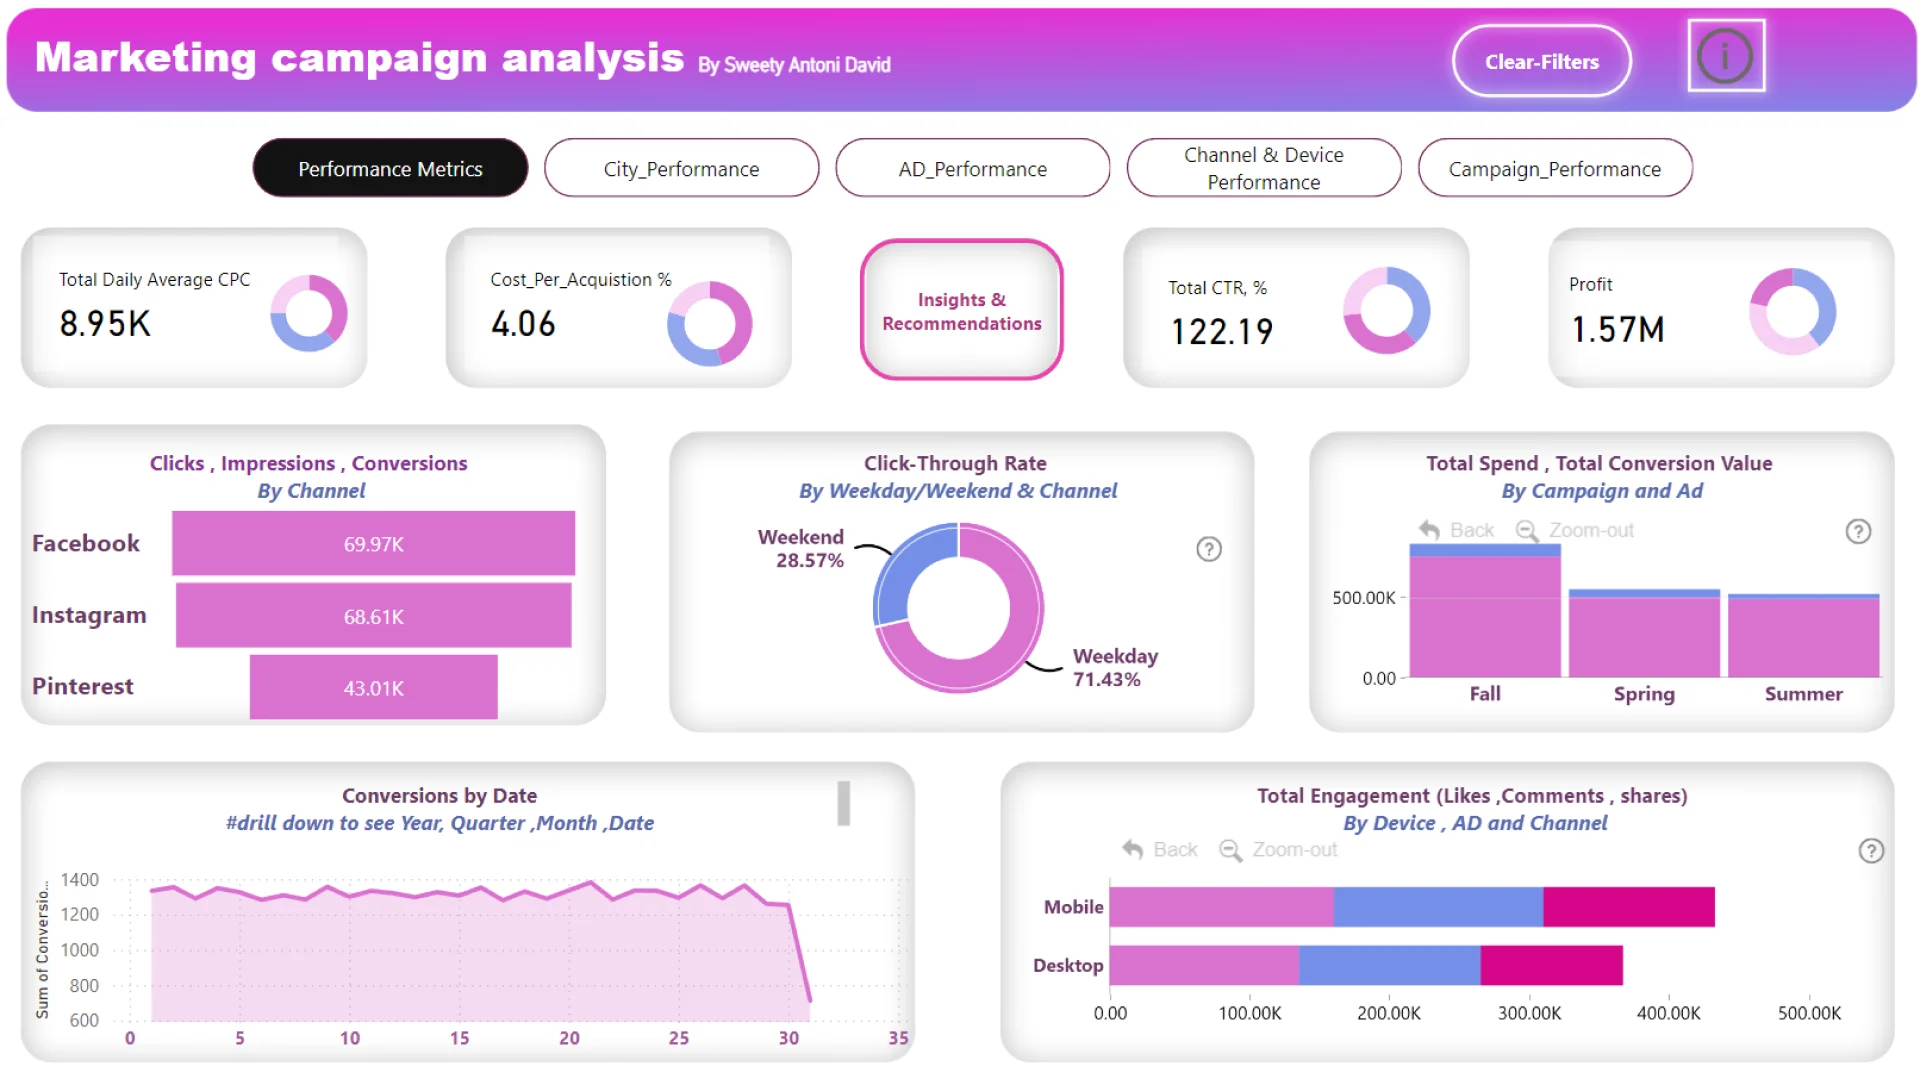
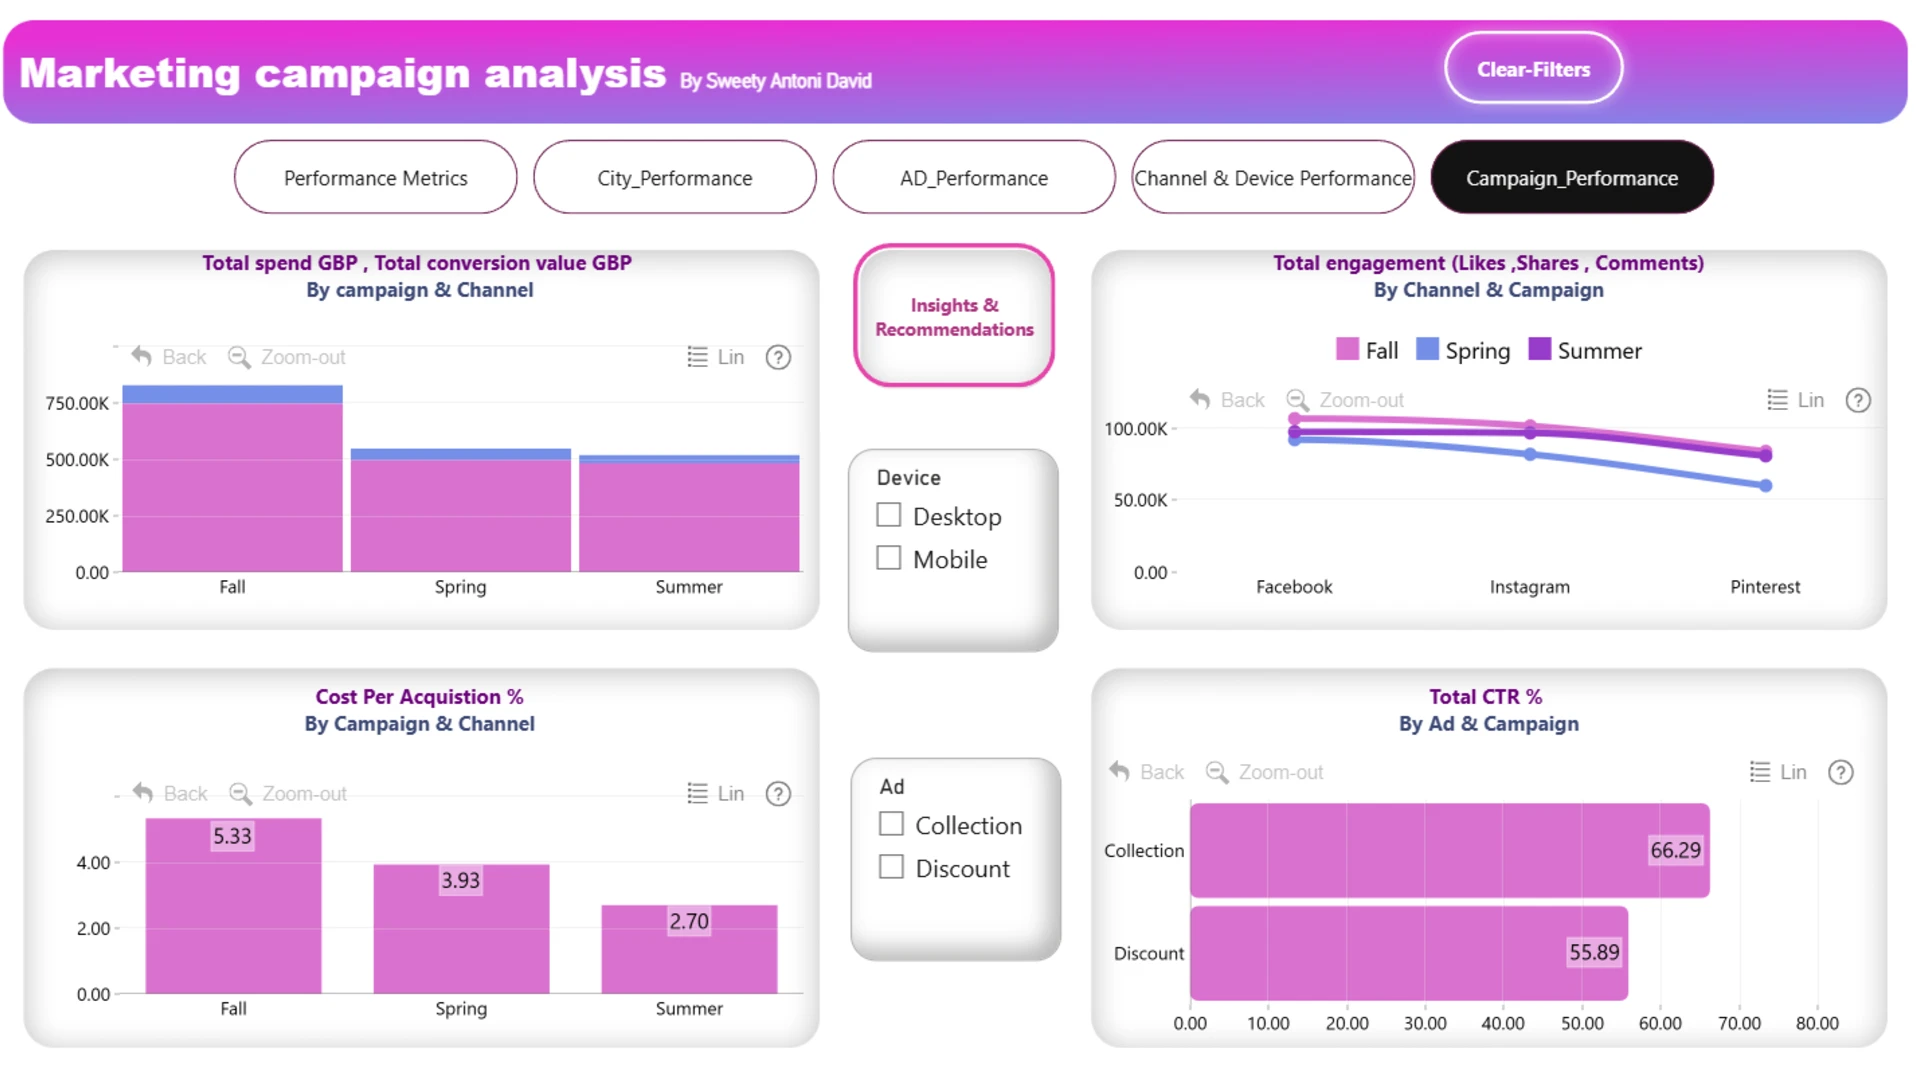
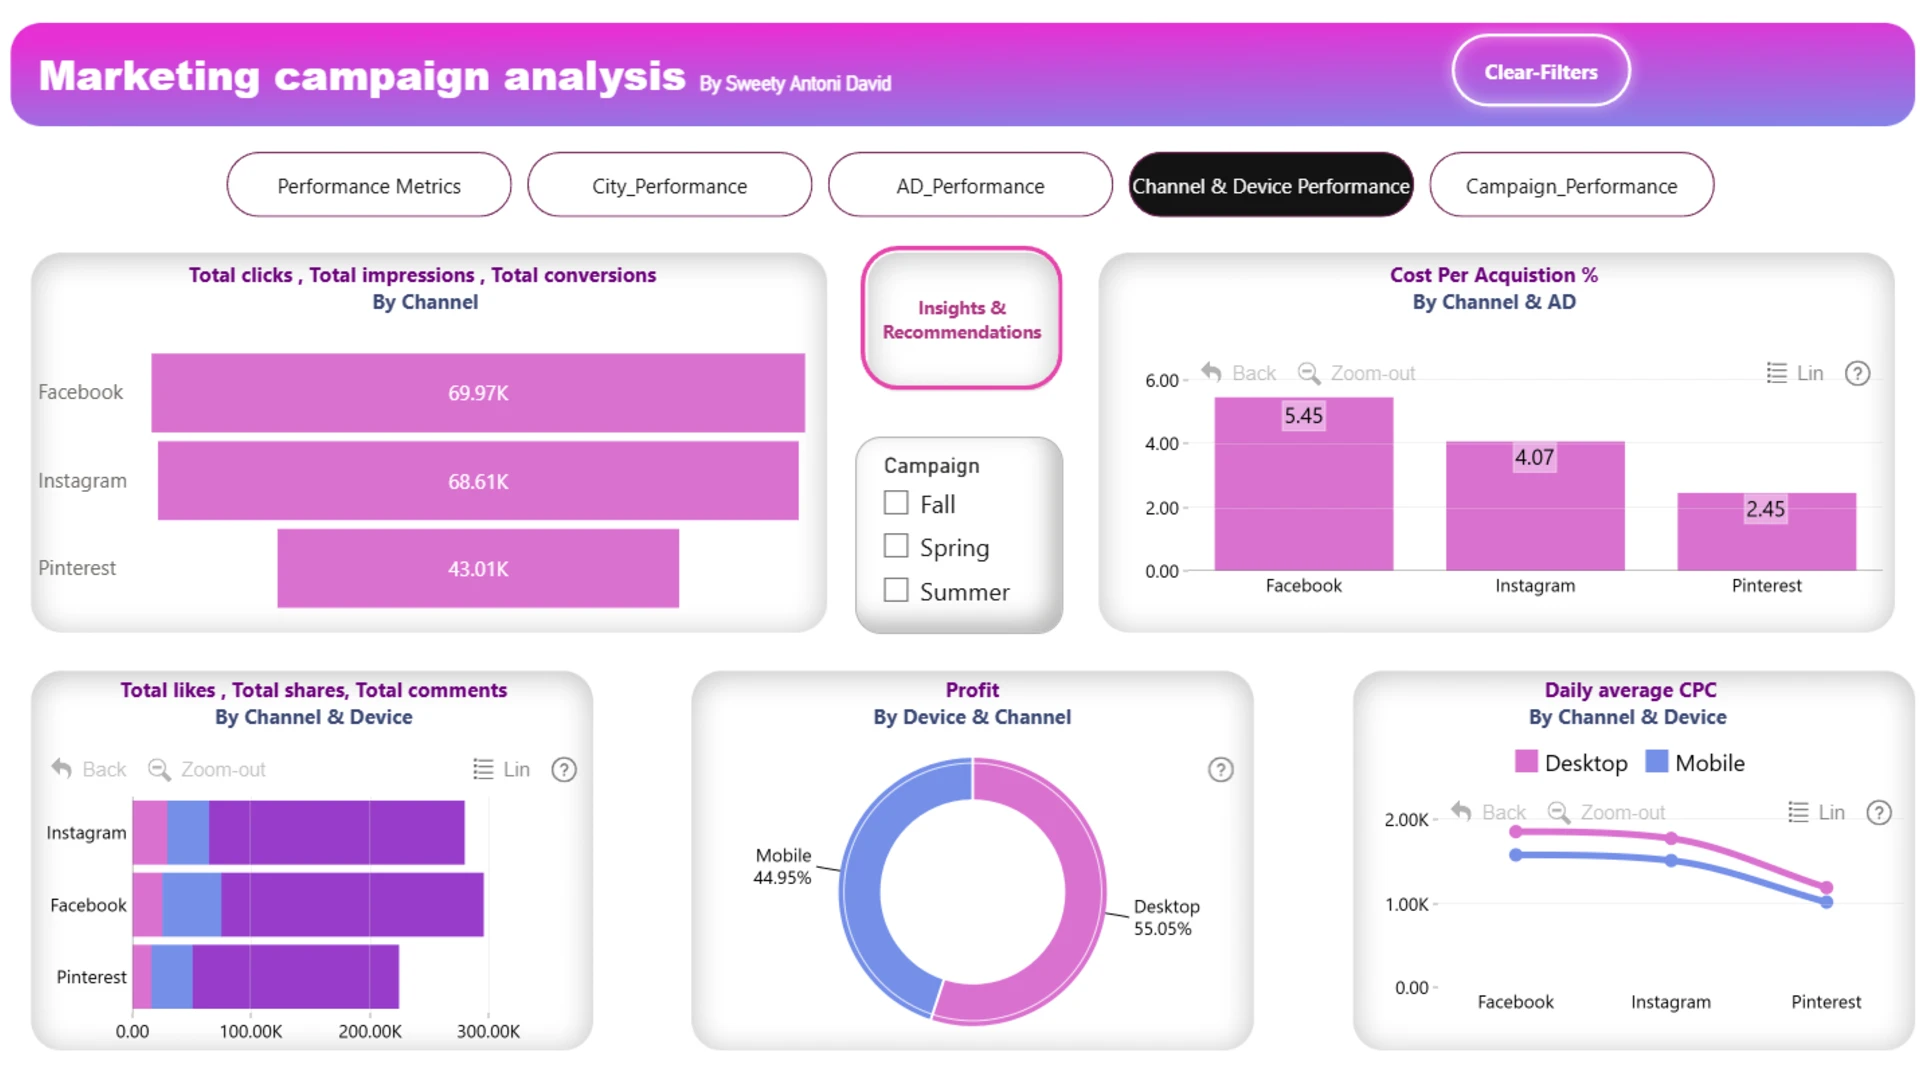
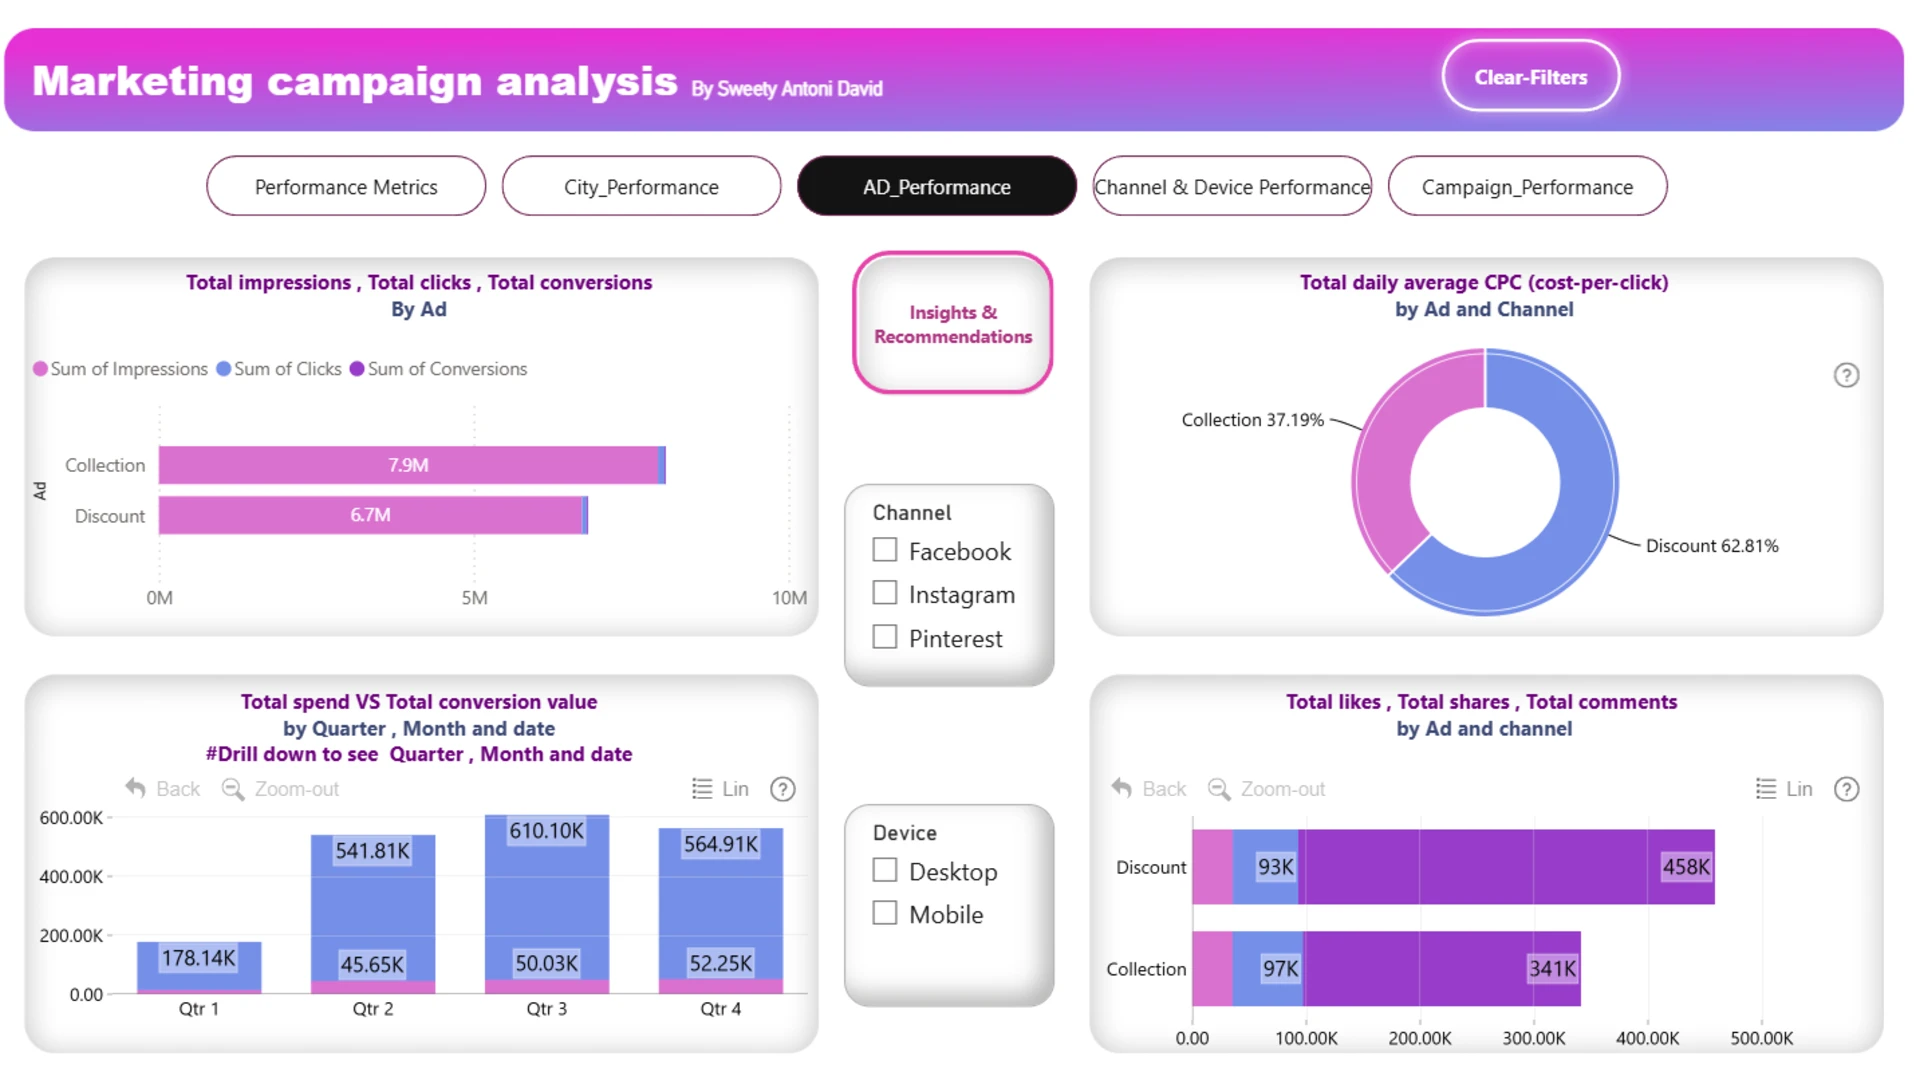
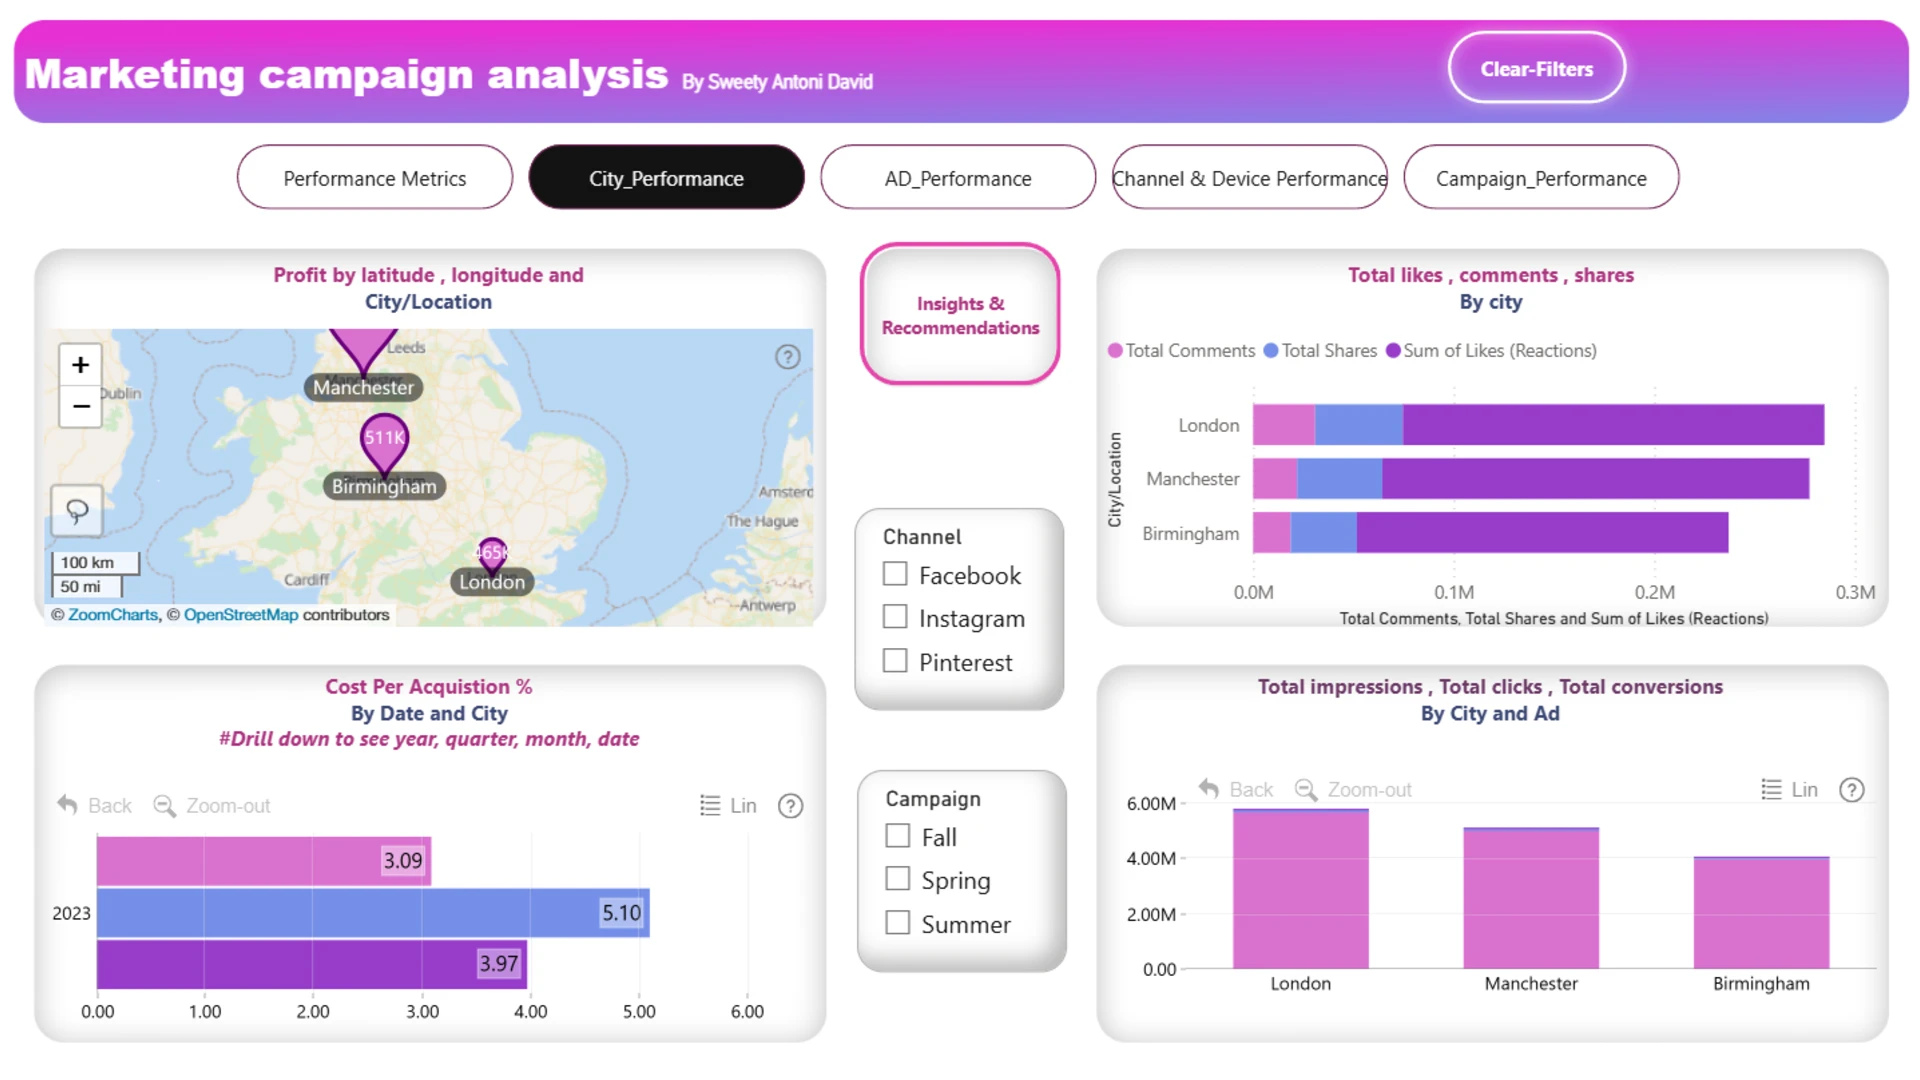
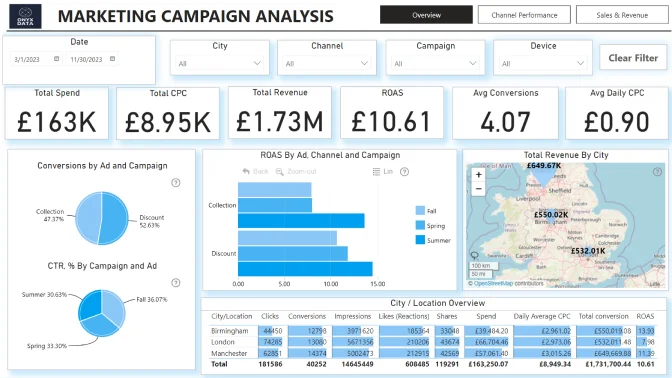
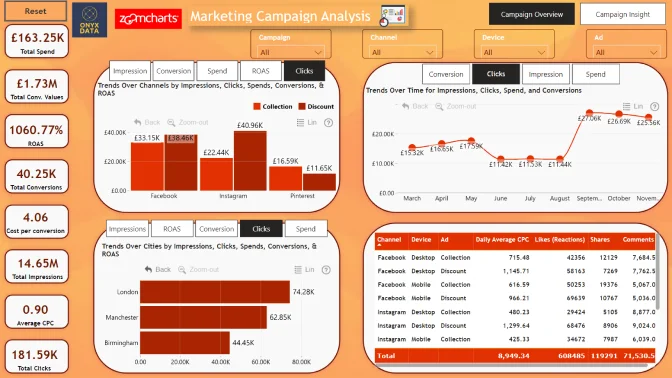
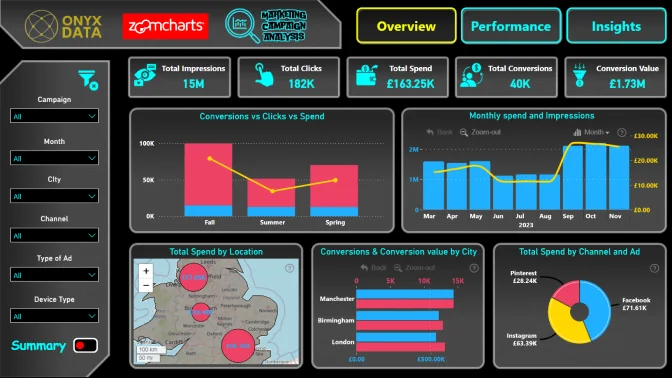
Explore a Power BI marketing campaign dashboard for analyzing ad spend, conversion value, CPA, CTR, engagement, channel performance, and seasonal campaign results. This report helps marketing teams compare Fall, Spring, and Summer campaigns, review performance across Pinterest, Instagram, and Facebook, and evaluate how budget, device experience, and audience engagement relate to campaign conversions.
ZoomCharts visuals used
4U Report Challenges
Participate in data challenges, build and submit reports to get free template downloads.
Join CommunityMobile view allows you to interact with the report. To Download the template please switch to desktop view.
Was this helpful? Thank you for your feedback!
Sorry about that.
How can we improve it?