696
Marketing Campaign Analysis 24
Marketing Campaign Analysis 24
Report Author: Sunny Bibyan
696
Share template with others
Report submitted for OnyxData #DataDNA and ZoomCharts Challenge June 2024. The report was built with the Marketing Campaing Dataset and includes ZoomCharts custom Drill Down PRO visuals for Power BI.
Author's description:
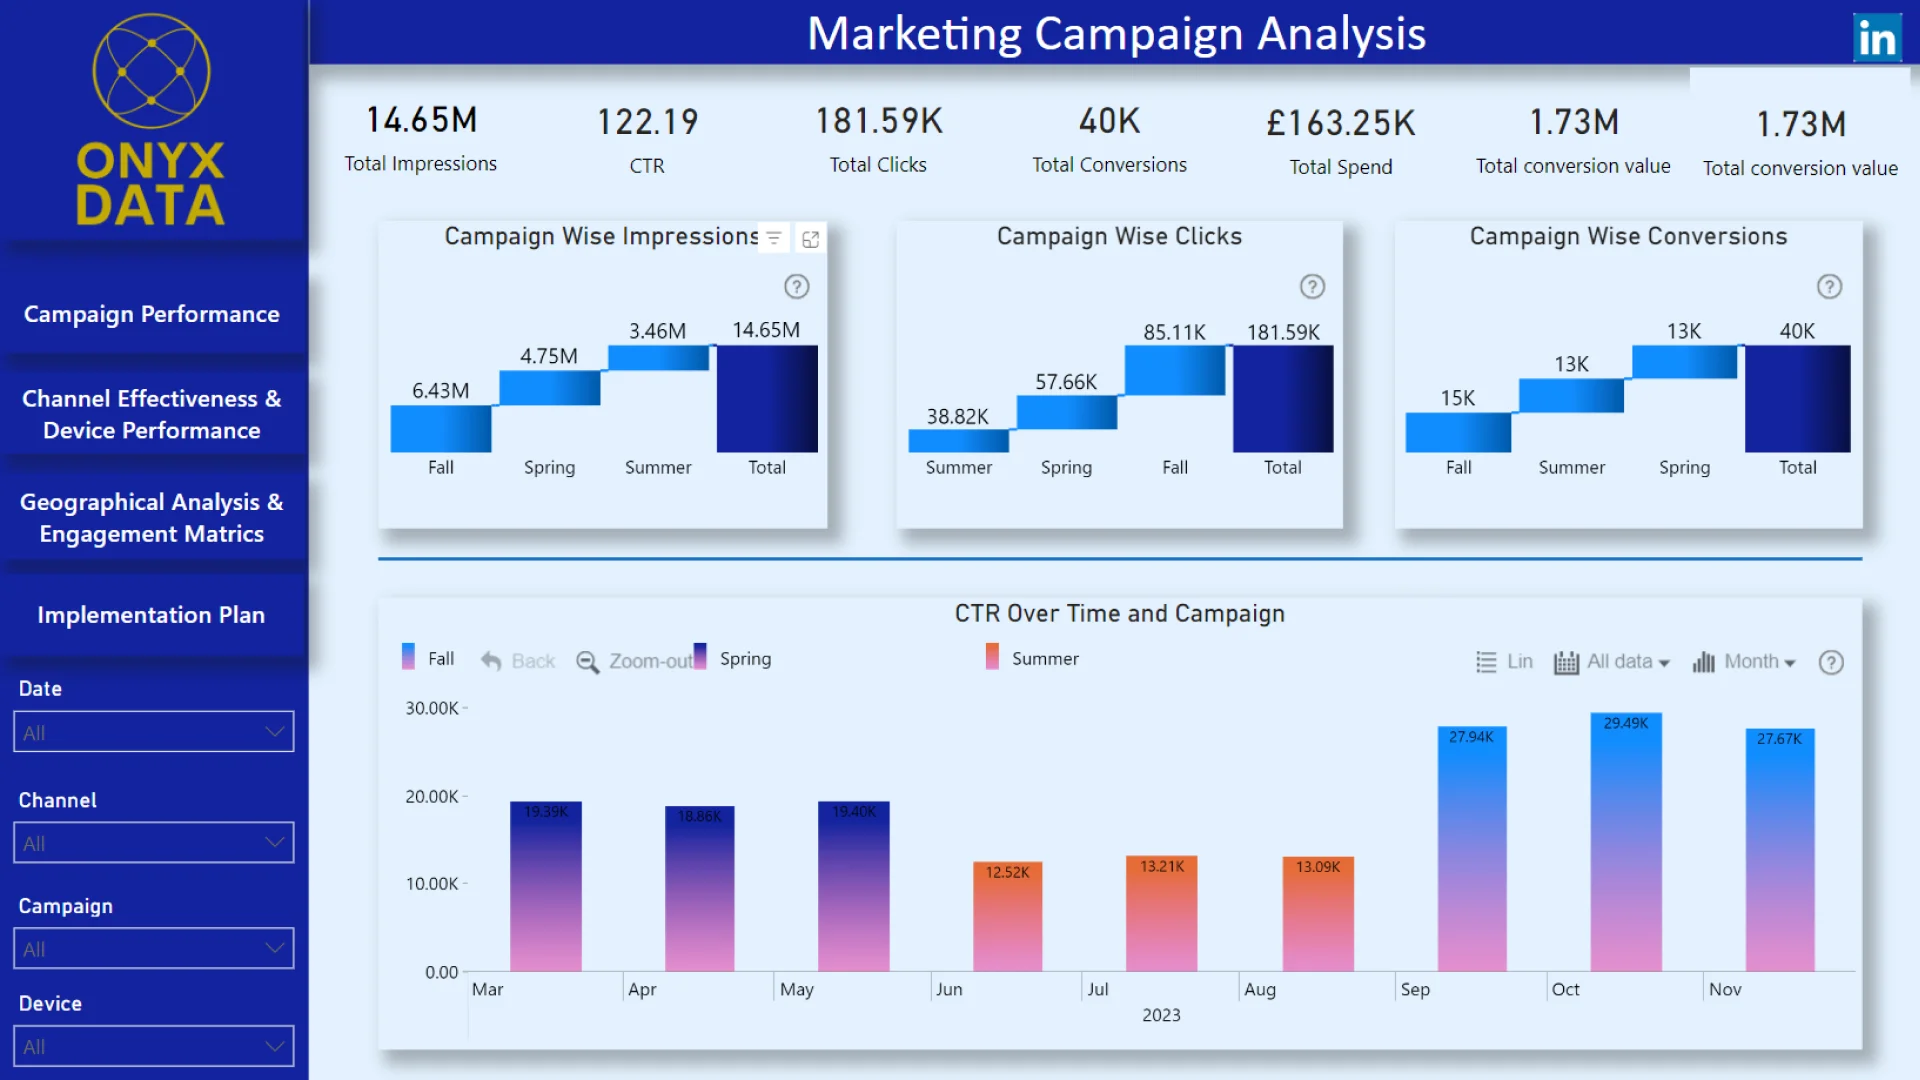
The data reveals that the Fall campaign outperformed the Spring and Summer campaigns across several key metrics. Specifically, the Fall campaign generated the highest number of impressions (6.4M), clicks (85K), and conversions (15K). Additionally, the Fall campaign maintained a higher CTR over time compared to the other campaigns, peaking at 0.519 in certain periods. This indicates that the strategies employed during the Fall campaign were particularly effective in engaging the audience and driving conversions.
Despite having lower overall impressions and clicks compared to Fall, the Spring campaign achieved a significant number of conversions (13K), suggesting efficient conversions despite lower engagement. On the other hand, the Summer campaign had the lowest impressions and clicks but achieved similar conversion numbers to Spring, indicating opportunities for improvement in both engagement and conversion rates.
ZoomCharts visuals used
4U Report Challenges
Participate in data challenges, build and submit reports to get free template downloads.
Join CommunityMobile view allows you to interact with the report. To Download the template please switch to desktop view.


Was this helpful? Thank you for your feedback!
Sorry about that.
How can we improve it?