logo
For Power BI
  • Products
    • Custom Visuals for Power BI
    • Report Templates
  • Resources

      Resources

    • Documentation
    • Report Examples
    • Blog
    • Webinars
    • Video Tutorials
    • Visuals Gallery

    Support

    • ZoomCharts Assistance
    • Contact Sales
    • Contact Support
    • FAQ

    Challenges

    Challenges

    Improve your report creation skills by participating in free challenges for report creators.

    Learn more
    Get Developer License
  • Services
    • Power BI Report Development
    • Custom Visual Development
  • Challenges
  • Pricing
    • Custom Visuals for Power BI
    • Report Templates
Subscribe
Subscribe
Get it now
Go back

Contents

Contest logo
Contest logo
Contest logo
Contest logo
Try Free Now
Go back

Onyx Data June 2024 Challenge

Report Author: Agbata Dickson Ukolojo

408

Marketing Campaign Analysis

Report
Report Interact

Combo Combo Bar Timeline Donut Sales Marketing

Share template with others

Report submitted for OnyxData #DataDNA and ZoomCharts Challenge June 2024. The report was built with the Marketing Campaing Dataset and includes ZoomCharts custom Drill Down PRO visuals for Power BI.

Author's description:

For the marketing campaign analysis, I categorized metrics into three categories: Awareness, Engagement, and Performance.

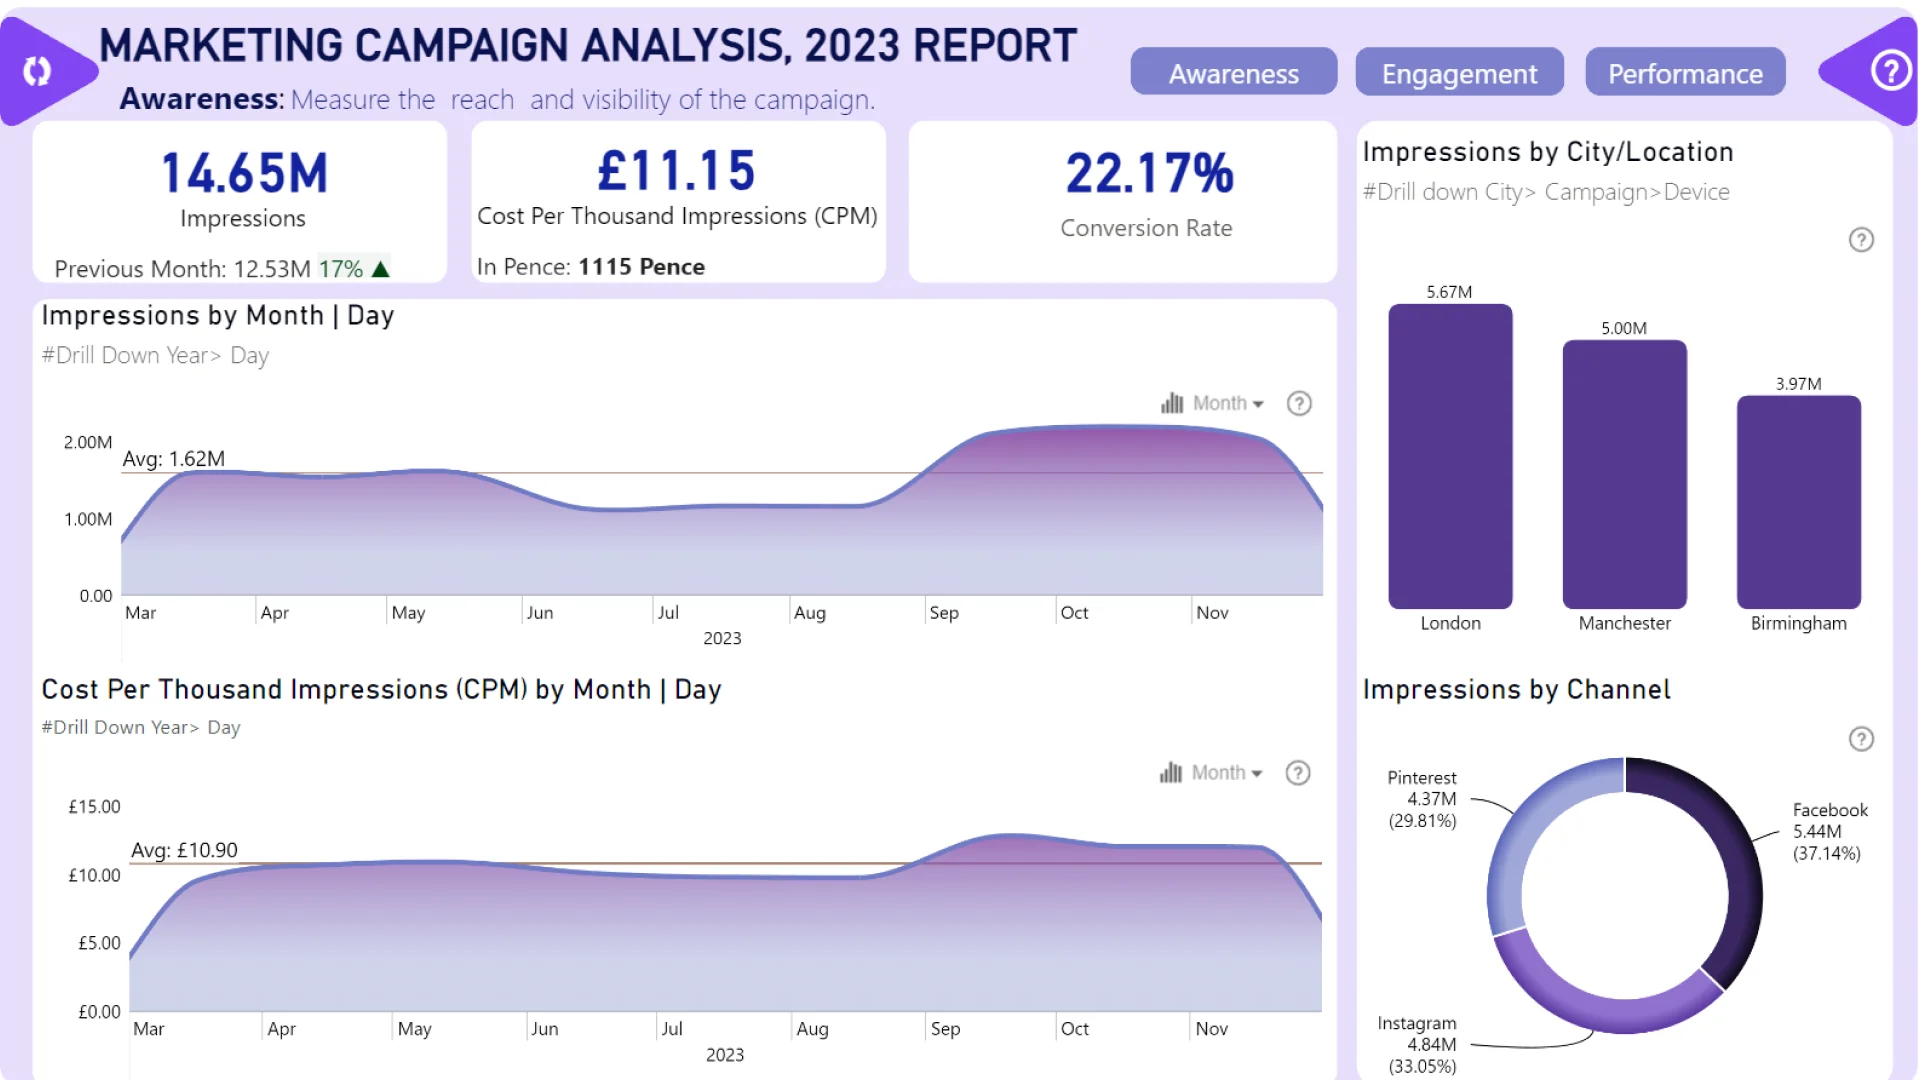
Awareness: This category aims to measure the reach and visibility of the campaign. Key performance indicators (KPIs) analyzed include impressions, cost-per-thousands (CPM), and conversion rate.

Engagement: This category assesses audience interactions with the ad. KPIs analyzed include likes, shares, comments, clicks, and click-through rate (CTR).

Performance: This category evaluates the overall effectiveness and financial return of the campaign. KPIs analyzed include Cost (Spend GBP), Revenue (Conversion value GBP), Cost-Per-Click (CPC), Profit, Return on Advertising Spend (ROAS), and Return on Investment (ROI).

KEY FINDINGS:

  1. Despite its lower budget, the summer campaign achieved the highest ROAS at 1409% and ROI at 1308.9%. Additionally, it reported the lowest CPM.

  2. Discount ads had the highest budget allocation and generated the highest revenue of £1,074,061.5, with an ROAS of 1179% and an ROI of 1079.3%. However, collection ads demonstrated the lowest CPM.

  3. The Pinterest channel incurred lower advertising costs while generating higher revenue compared to Facebook and Instagram. Pinterest achieved the highest ROAS at 2247% and ROI at 2147.3%, along with the lowest CPM.

  4. Birmingham had the lowest advertising costs, yielding substantial revenue of £550,019.1, an ROAS of 1393%, and an ROI of 1293%. Birmingham also reported the lowest CPM.

  5. Desktop devices had the highest costs but generated the highest revenue of £949,684.4, with the highest ROAS (1101%) and ROI (1001.5%). Mobile devices performed better in terms of impressions due to lower cost-per-thousand impressions.

RECOMMENDATIONS:

  1. Cost Efficiency and Budget Allocation:

    • Regularly evaluate and adjust budgets based on campaign performance, focusing on areas with the highest returns.
    • Continue to monitor and aim to reduce CPM across all campaigns to improve ROI.
  2. Data-Driven Decision Making:

    • Implement a robust tracking system to continuously measure key metrics like ROAS, ROI, and CPM.
    • Use A/B testing to refine ad creatives and targeting strategies for optimal performance.
  3. Channel Optimization:

    • Diversify advertising efforts across multiple channels but allocate more resources to those demonstrating higher ROI.
    • Stay updated with trends and best practices for each platform to maintain a competitive advantage.
  4. Geographic and Demographic Insights:

    • Analyze geographic and demographic data to identify other potential high-performing markets.
    • Customize campaigns to the preferences and behaviors of audiences in different regions for better engagement and conversion rates.

By following these recommendations, the marketing team can enhance the effectiveness and profitability of future campaigns, ensuring sustained growth and improved return on marketing investments.

ZoomCharts visuals used

Drill Down Combo PRO Drill Down Combo PRO
Drill Down Combo Bar PRO Drill Down Combo Bar PRO
Drill Down Timeline PRO Drill Down Timeline PRO
Drill Down Donut PRO Drill Down Donut PRO

Need help?

Send your question to ZoomCharts assistant, and we will respond to you as soon as possible.

Contact Us

Mobile view allows you to interact with the report. To Download the template please switch to desktop view.

Report Overhaul

ZoomCharts Academy

Learn ZoomCharts with experts and become certified!

Go to Academy!
Report Overhaul

Was this helpful? Thank you for your feedback!

Sorry about that.

How can we improve it?

Marketing Campaign Analysis

Share

ZoomCharts

Welcome to ZoomCharts

You’re almost there! Create an account to keep your saved reports.

or
Sign up with Microsoft

Verify your email address

We have sent a code to your email address. Please input the code below.

Didn't receive code? Request again (after 30 seconds)

Already have an account? Log in

ZoomCharts

Log in to your ZoomCharts account

Log in with Microsoft
or
Forgot password?

Reset your password

We'll email you instructions on how to reset your password

Don't have an account? Sign up

Please add credits

You have 0 available downloads.
Get more credits or upgrade your plan to continue.

View pricing
logo
[email protected]
+44 204 577 3993
logo

Products

Drill Down Network PRO Drill Down Waterfall PRO Drill Down Graph PRO Drill Down Combo PRO Drill Down Combo Bar PRO Drill Down Donut PRO Drill Down Pie PRO Drill Down TimeSeries PRO Drill Down Timeline PRO Drill Down Map PRO Drill Down Scatter PRO All Visuals

Resources

Report Examples Webinars Blog ZoomCharts Academy Visuals Gallery Documentation Custom Visual Development Subscribe to News

Solutions

Custom Visual Development

Company

Pricing About Us Partners Leave feedback Join PowerGroup EU Funding

Help

ZoomCharts Assistance Contact Sales Contact Support FAQ

Drill Down Network PRO Drill Down Waterfall PRO Drill Down Graph PRO Drill Down Combo PRO Drill Down Combo Bar PRO Drill Down Donut PRO Drill Down Pie PRO Drill Down TimeSeries PRO Drill Down Timeline PRO Drill Down Map PRO Drill Down Scatter PRO All Visuals

Report Examples Webinars Blog ZoomCharts Academy Visuals Gallery Documentation Custom Visual Development Subscribe to News

Custom Visual Development

Pricing About Us Partners Leave feedback Join PowerGroup EU Funding

ZoomCharts Assistance Contact Sales Contact Support FAQ
+44 204 577 3993
[email protected]

Ready to get in touch?

Contact our experts with any question about Power BI and ZoomCharts for Free!

Contact us

© 2025, Data Visualization Software Lab

U.S. Patents No. 11,645,343; 11,921,804; 12,346,389

Cookies
Privacy Policy
Global
Legal
Patent
warning

Error message

success

Success info: Done!

ZoomCharts AI Assistant

We noticed you're using an old OS version.

For the best experience, we recommend upgrading to ensure that all website features display correctly.

Cookie settings

We use necessary cookies for site functionality, as well as statistic, marketing, and preference cookies to enhance your experience. For more information and to manage your preferences, please visit our Cookie policy