665
Fuel management
Fuel management
Report Author: Sahar Jamal
665
Share template with others
Report submitted for FP20 Analytics ZoomCharts Challenge 14 (March 2024). The report was built with the National Fuel Market Analysis dataset and includes ZoomCharts custom Drill Down PRO visuals for Power BI.
Author's description:
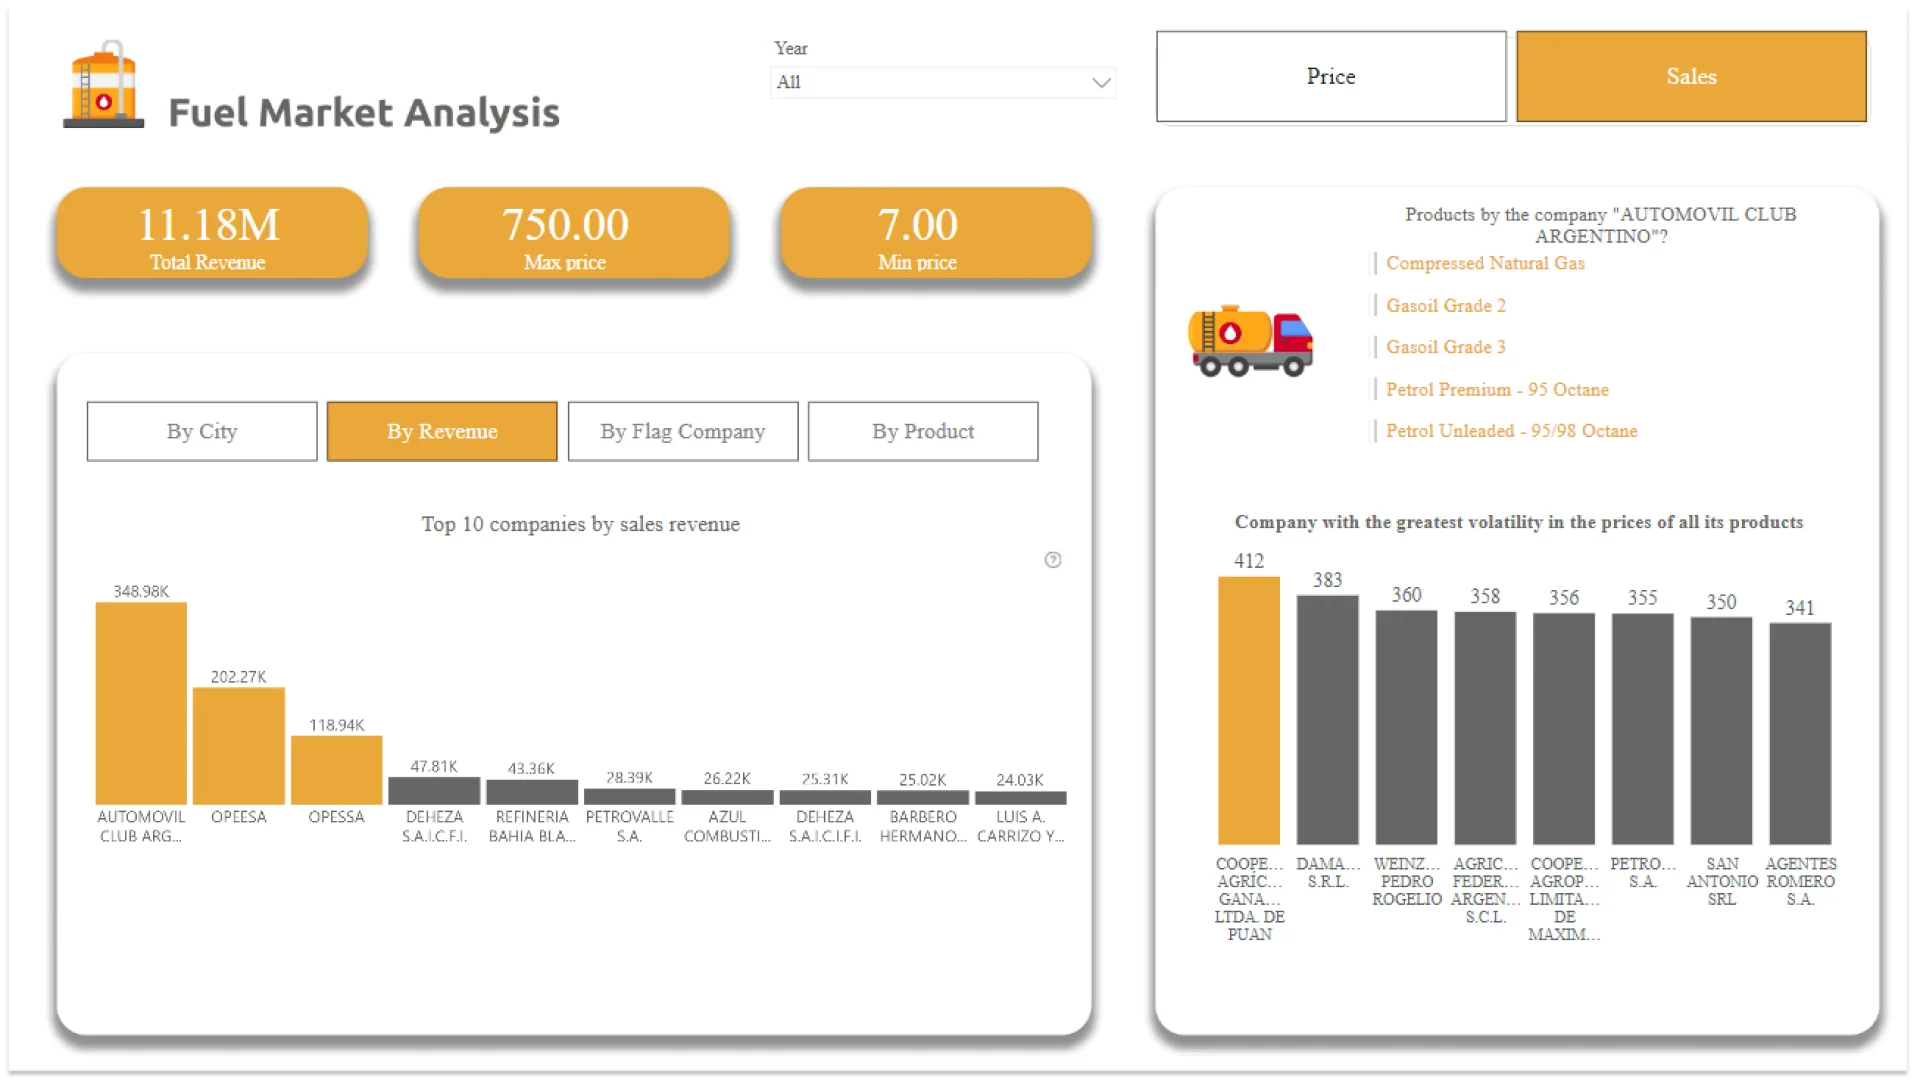
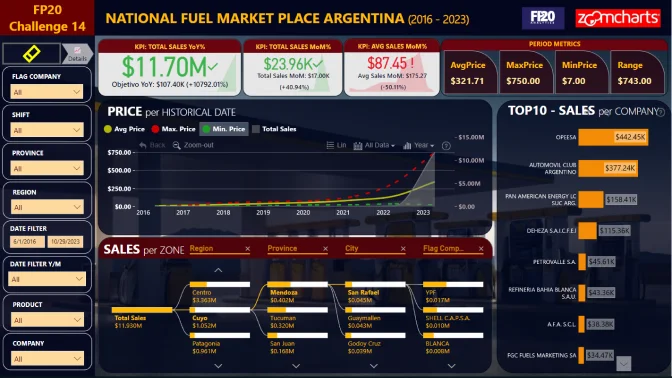
Keeping in mind the variety of business questions for this report (along with many different parameters), I have kept the chars to the point. I have added slicers to address some general questions only. ZoomCharts used: page 1 (price) : combo chart on grade 3 visual and map page 2: almost all visuals are ZoomCharts
4U Report Challenges
Participate in data challenges, build and submit reports to get free template downloads.
Join CommunityMobile view allows you to interact with the report. To Download the template please switch to desktop view.
Was this helpful? Thank you for your feedback!
Sorry about that.
How can we improve it?