1320
FP20 Analytics Data-Driven Education Management Ajay Singh
FP20 Analytics Data-Driven Education Management Ajay Singh
More Report pages
Report Author: Ajay Singh
1320
Share template with others
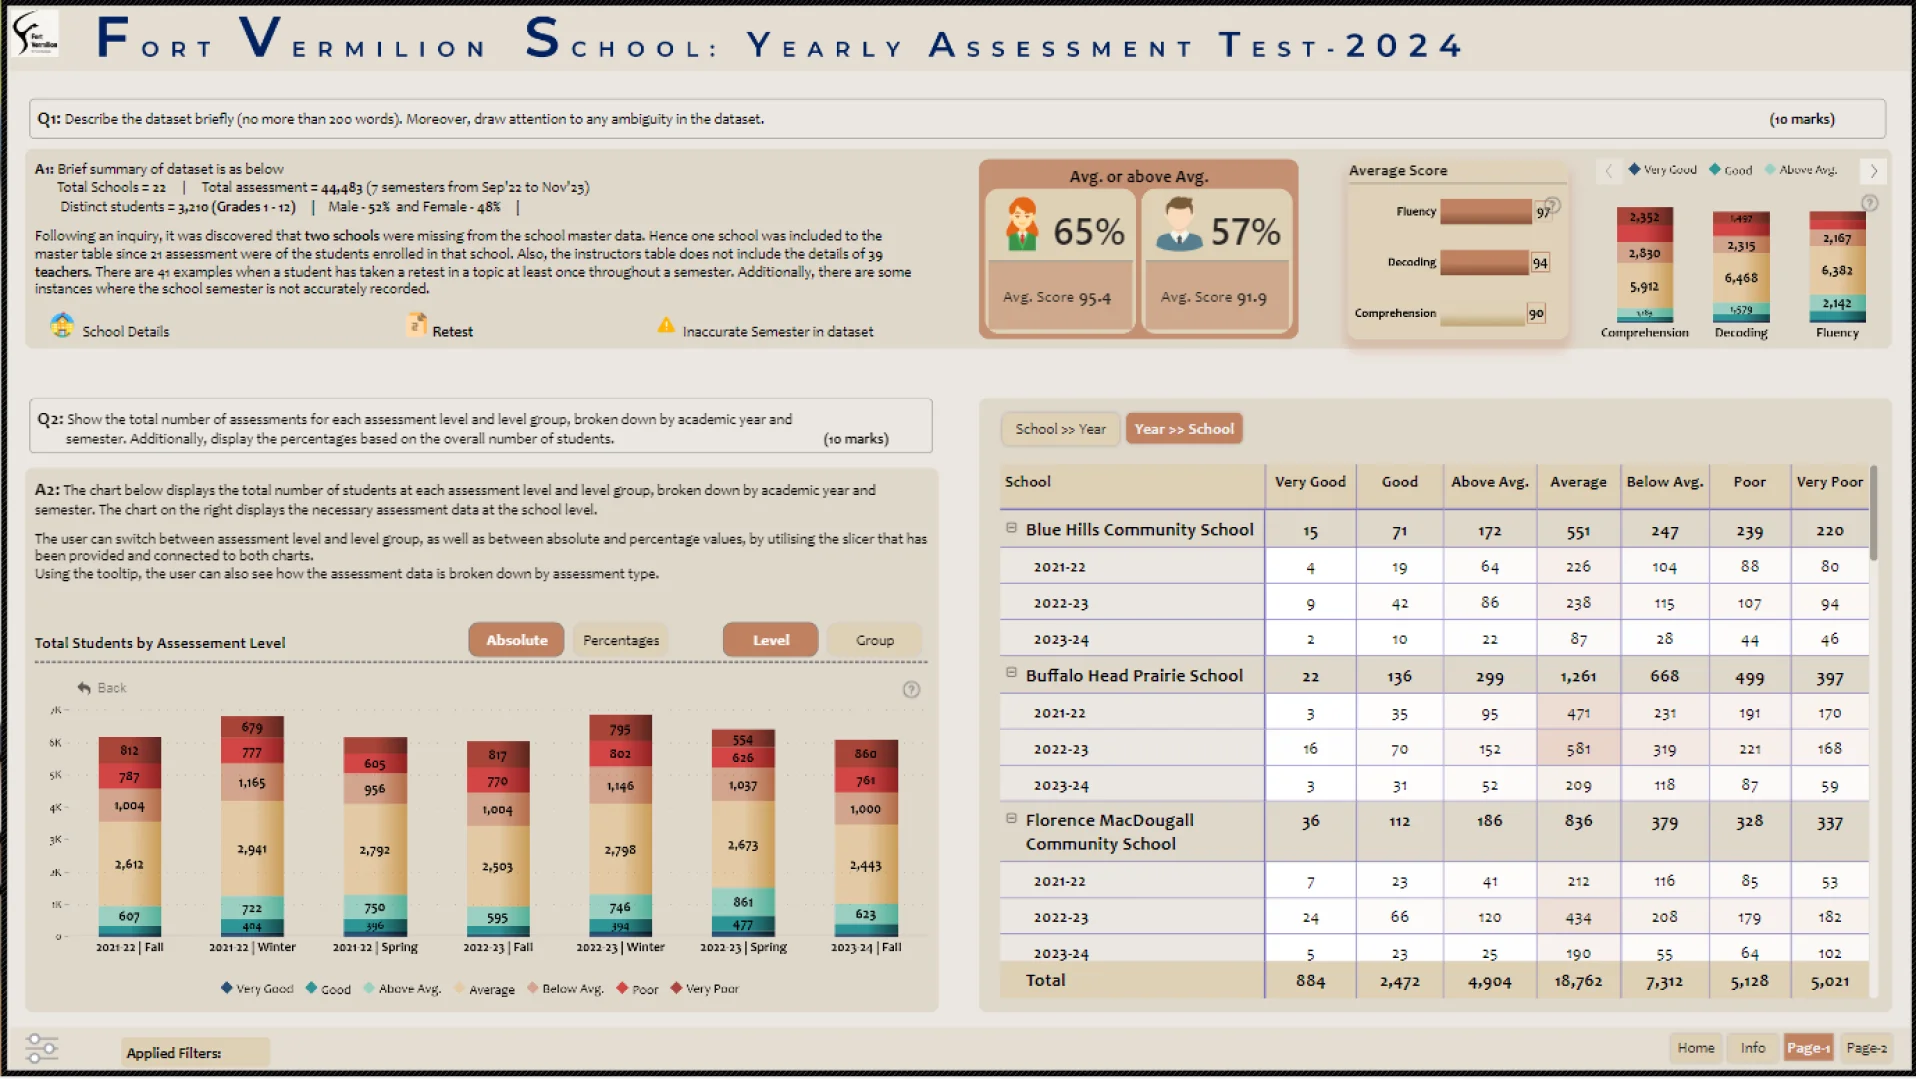
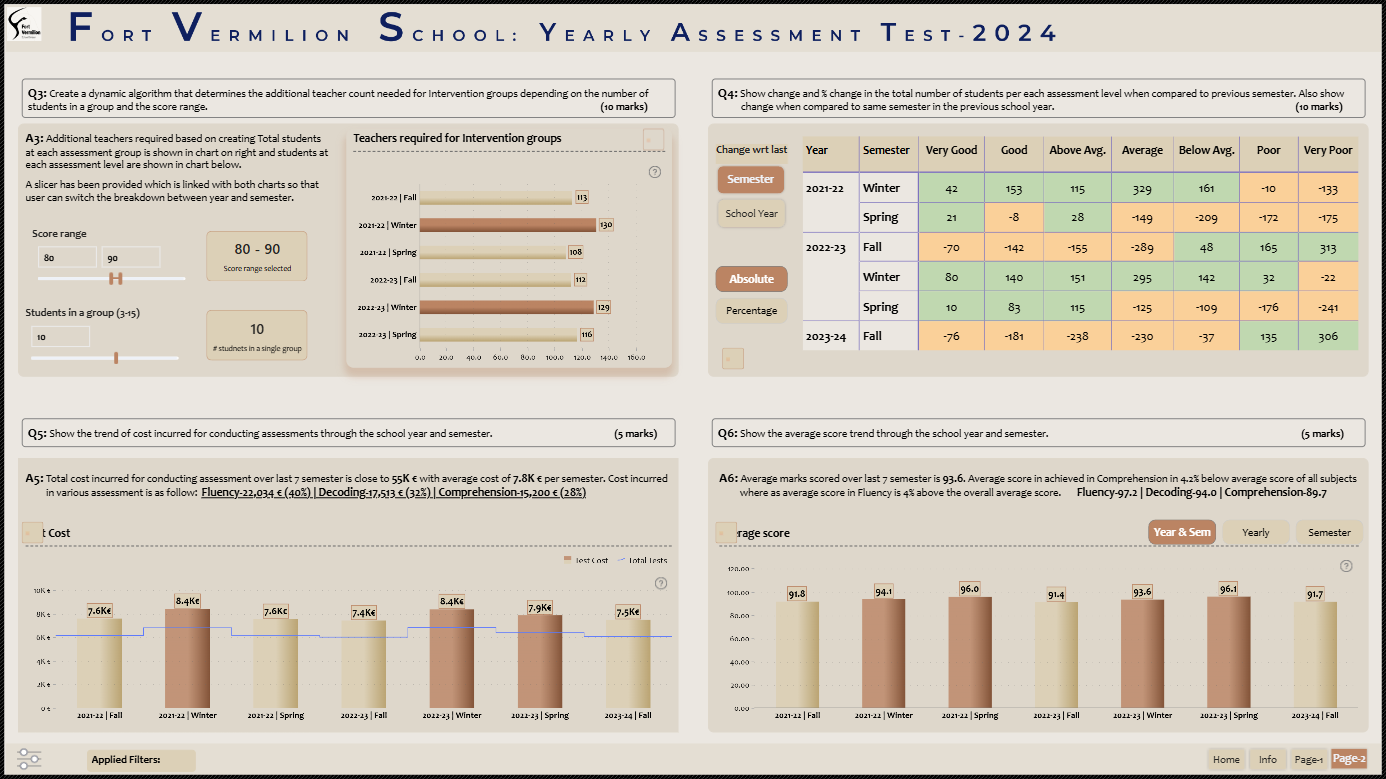
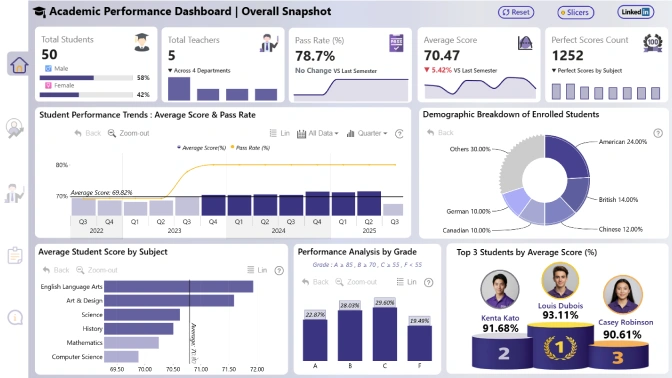
Report submitted for FP20 Analytics ZoomCharts Challenge 13 (Jan 17 – Feb 15, 2024). The report was built with Education Management dataset and includes ZoomCharts custom Drill Down PRO visuals for Power BI.
Author's description:
🌟 Join me in the exhilarating journey of unraveling educational data to navigate through a treasure trove of educational insights, helping the School Division steer the ship towards strategic planning, comprehend student performance intricacies, and chart a course for optimal teacher resource allocation.📊
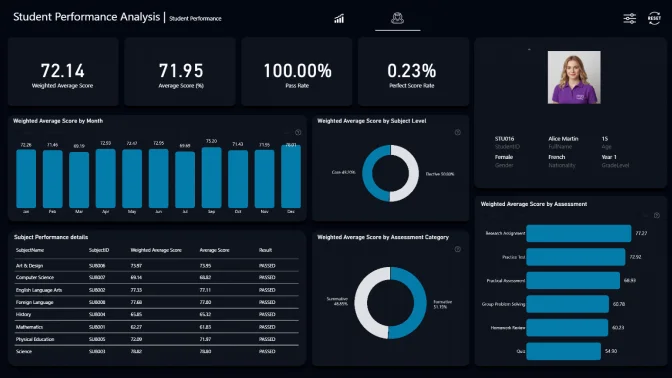
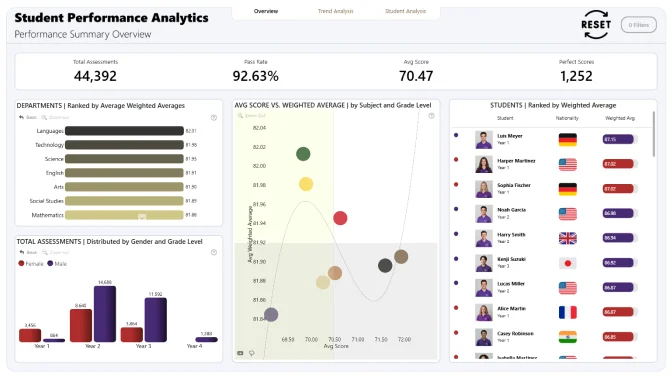
✨ This power BI report explores the vast expanse of educational data, including school details, student profiles, teacher insights, and test metrics.
👩🏫 Uncovering trends, assessing scored, and deciphering the mysteries of student performance across different schools and subjects. This Power BI wizardry will play a pivotal role in aiding the School Division's strategic planning for assessments and future improvements. 🚀
4U Report Challenges
Participate in data challenges, build and submit reports to get free template downloads.
Join CommunityMobile view allows you to interact with the report. To Download the template please switch to desktop view.
Was this helpful? Thank you for your feedback!
Sorry about that.
How can we improve it?