1763
FP20 Analytics Challenge 13: Data-Driven Education Management
FP20 Analytics Challenge 13: Data-Driven Education Management
More Report pages
Report Author: Lashmi Dissanayake
1763
Share template with others
Report submitted for FP20 Analytics ZoomCharts Challenge 13 (Jan 17 – Feb 15, 2024). The report was built with Education Management dataset and includes ZoomCharts custom Drill Down PRO visuals for Power BI.
Author's description:
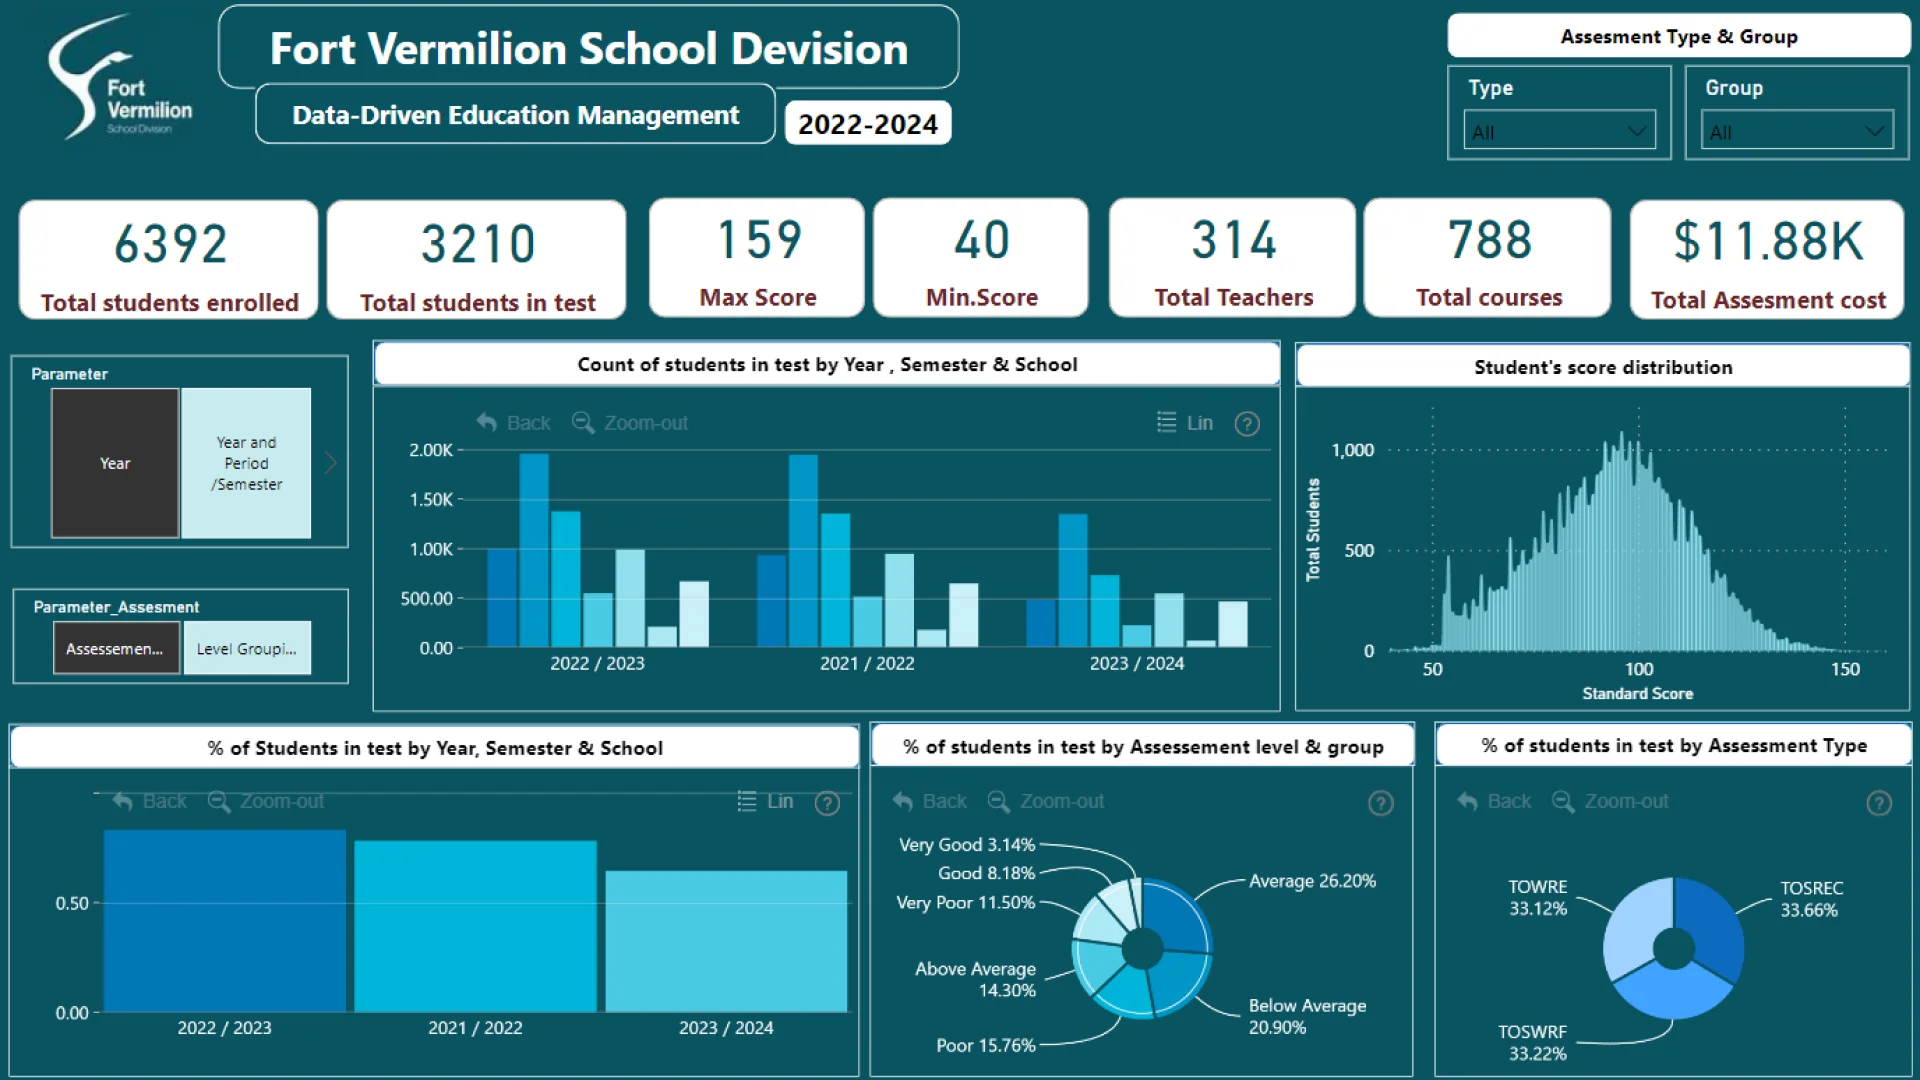
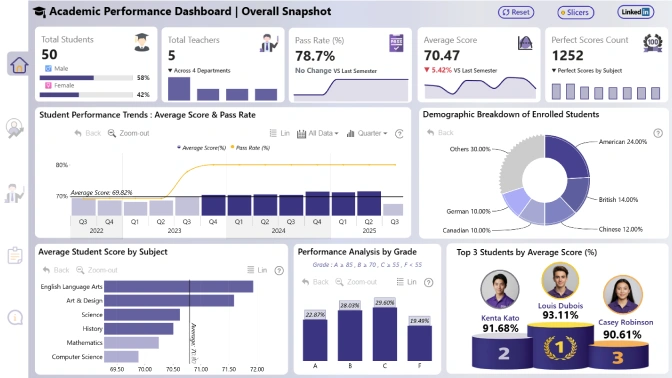
Report highlights: The report represent detailed analysis of student performance across different school years, semester, schools etc., for Fort Vermilion School Division - Alberta, Canada.
- The detailed analysis of number of students and percentage of students participated to the test in different semesters by different assessment levels & groups.
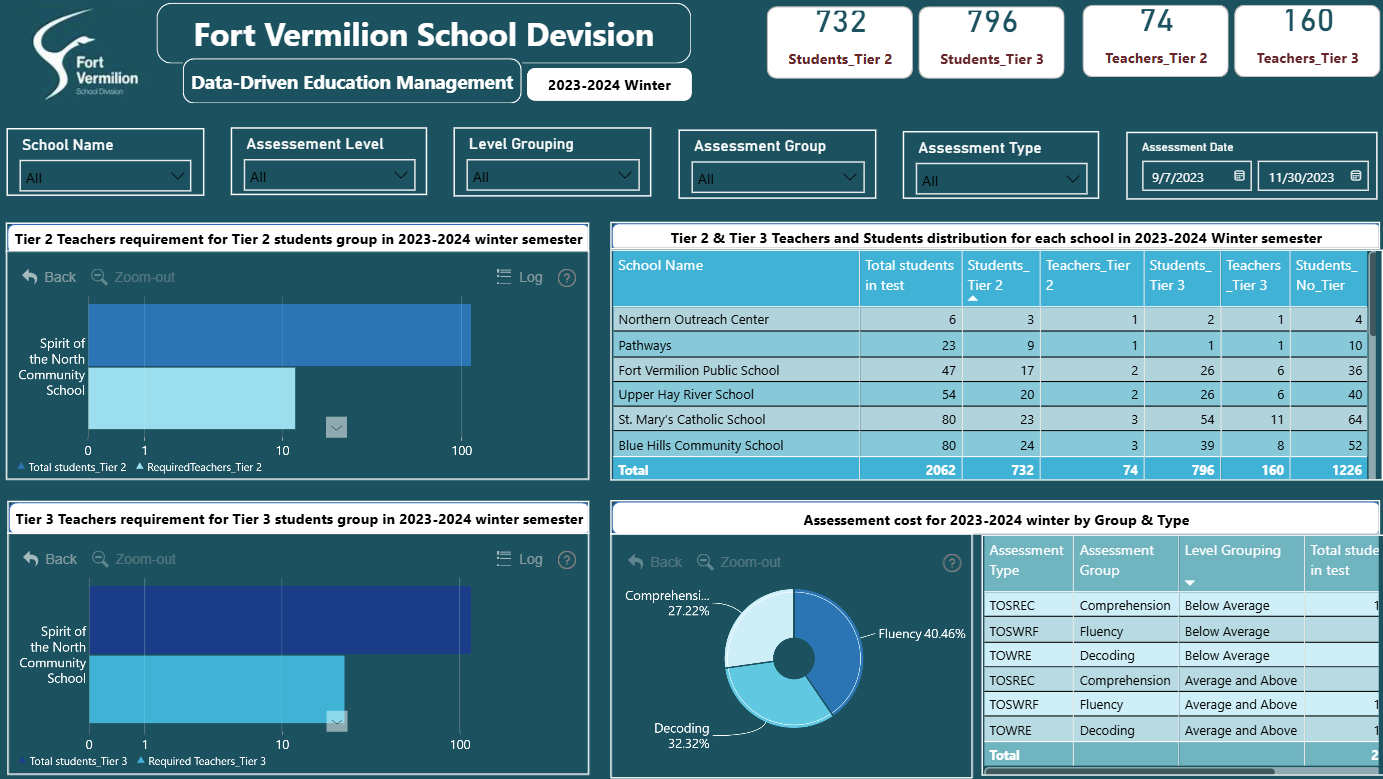
- The number of students and teachers in Tier 2 & Tier 3 Intervention Groups based on student's test results to allocate teachers for each student groups.
- Projection of testing cost for the 2023-2024 winter semester based on fall semester results for facilitate budget allocation and planning.
ZoomCharts visuals used
4U Report Challenges
Participate in data challenges, build and submit reports to get free template downloads.
Join CommunityMobile view allows you to interact with the report. To Download the template please switch to desktop view.
Was this helpful? Thank you for your feedback!
Sorry about that.
How can we improve it?