814
Fitness Company Finance Analysis 24
Fitness Company Finance Analysis 24
More Report pages
Report Author: NOOR UL AIN
814
Share template with others
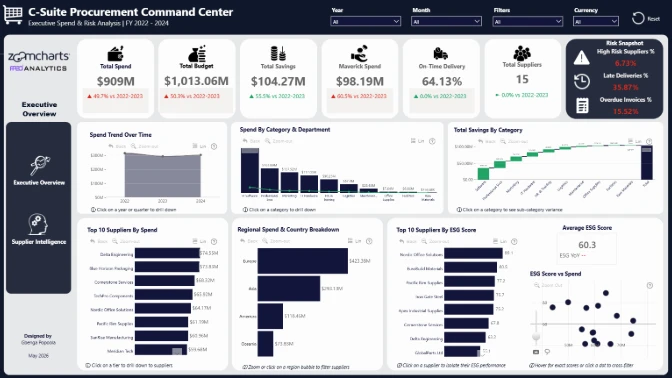
Report submitted for Onyx Data DataDNA ZoomCharts Mini Challenge, August 2024. The report was built based on Fitness Company Finance Dataset and includes ZoomCharts custom Drill Down PRO visuals for Power BI.
Author's description:
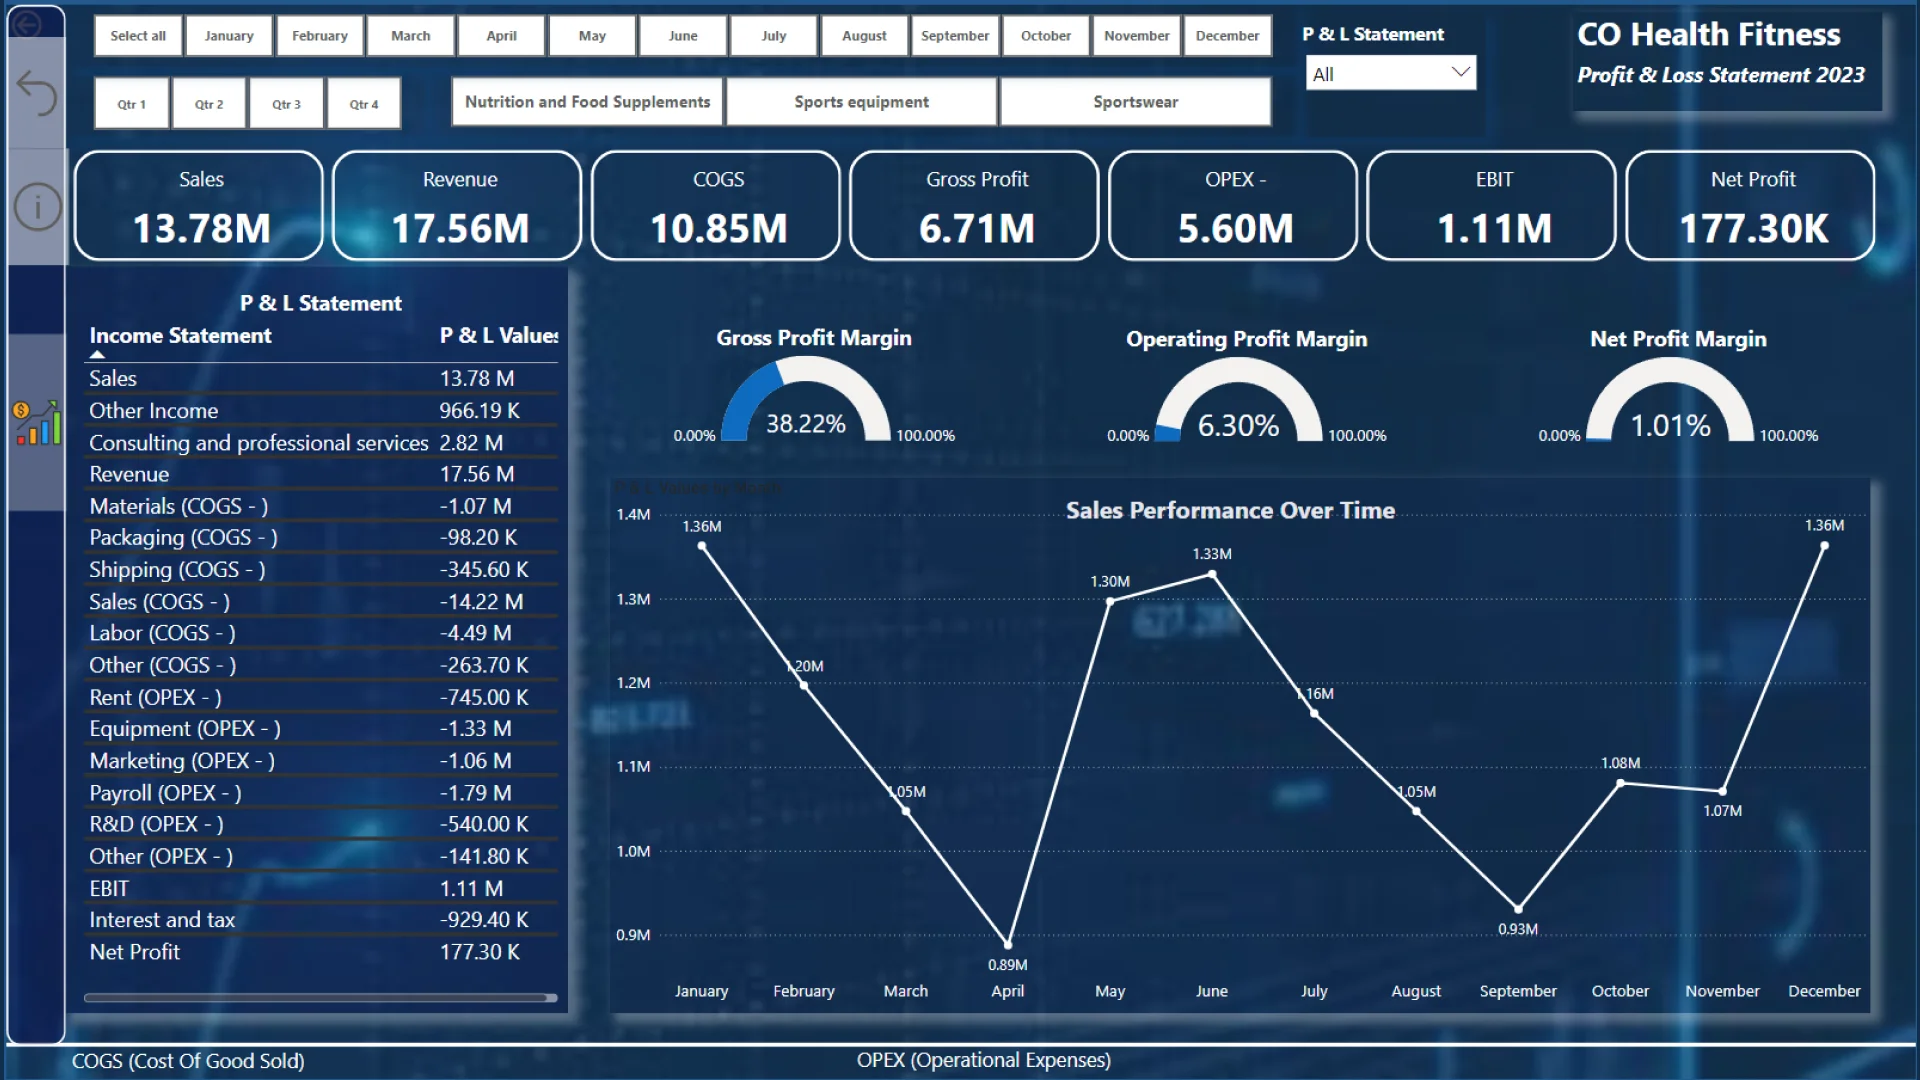
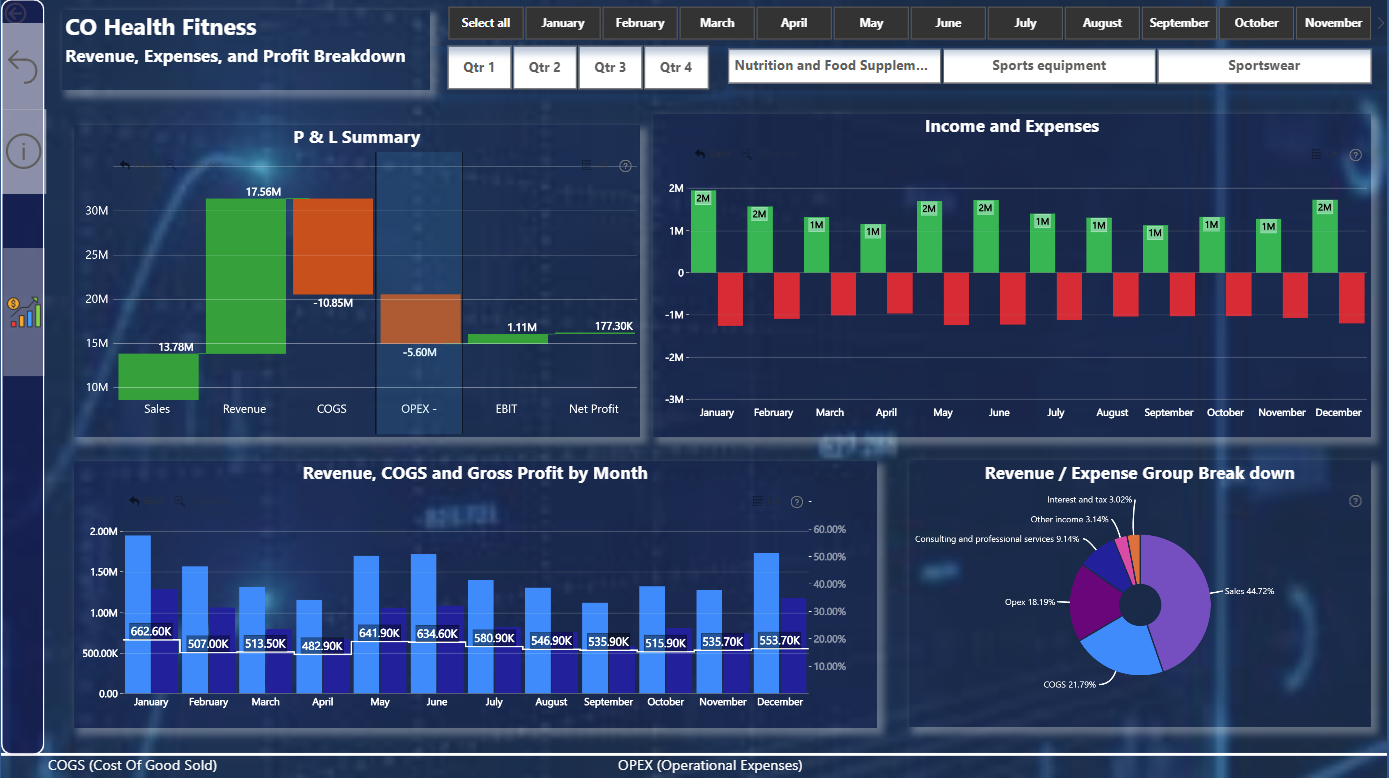
This dashboard offers a comprehensive overview of key financial metrics, providing actionable insights at a glance. With interactive visualizations, users can explore:
- Revenue, Costs, and Profit Margins over time
- Detailed breakdowns of Income and Expenses
- Performance analysis across different product categories and time periods
Creating this visualization was an exciting journey where I applied advanced techniques in data storytelling to transform raw data into powerful insights. It’s amazing how the right visuals can turn complex data into clear, strategic narratives that drive business growth.
4U Report Challenges
Participate in data challenges, build and submit reports to get free template downloads.
Join CommunityMobile view allows you to interact with the report. To Download the template please switch to desktop view.
Was this helpful? Thank you for your feedback!
Sorry about that.
How can we improve it?