697
Employee Performance and Productivity Analysis
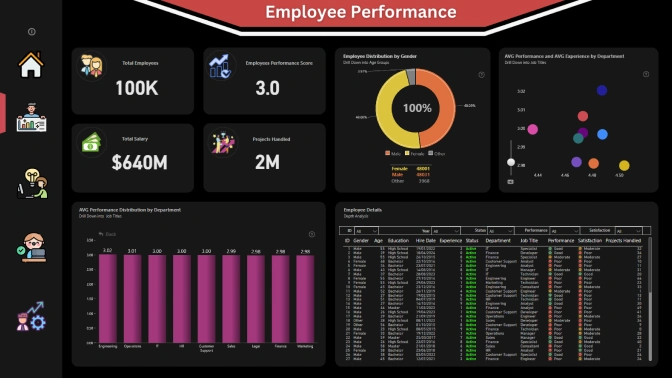
Employee Performance and Productivity Analysis
More Report pages
Report Author: Dileep Venkata Prasad Bocha
697
Share template with others
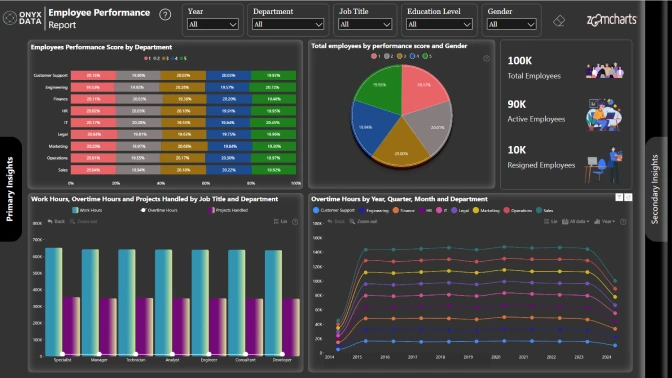
Report submitted for Onyx Data DataDNA ZoomCharts Mini Challenge, October 2024. The report was built based on Employee Performance dataset and includes ZoomCharts custom Drill Down PRO visuals for Power BI.
Author's description:
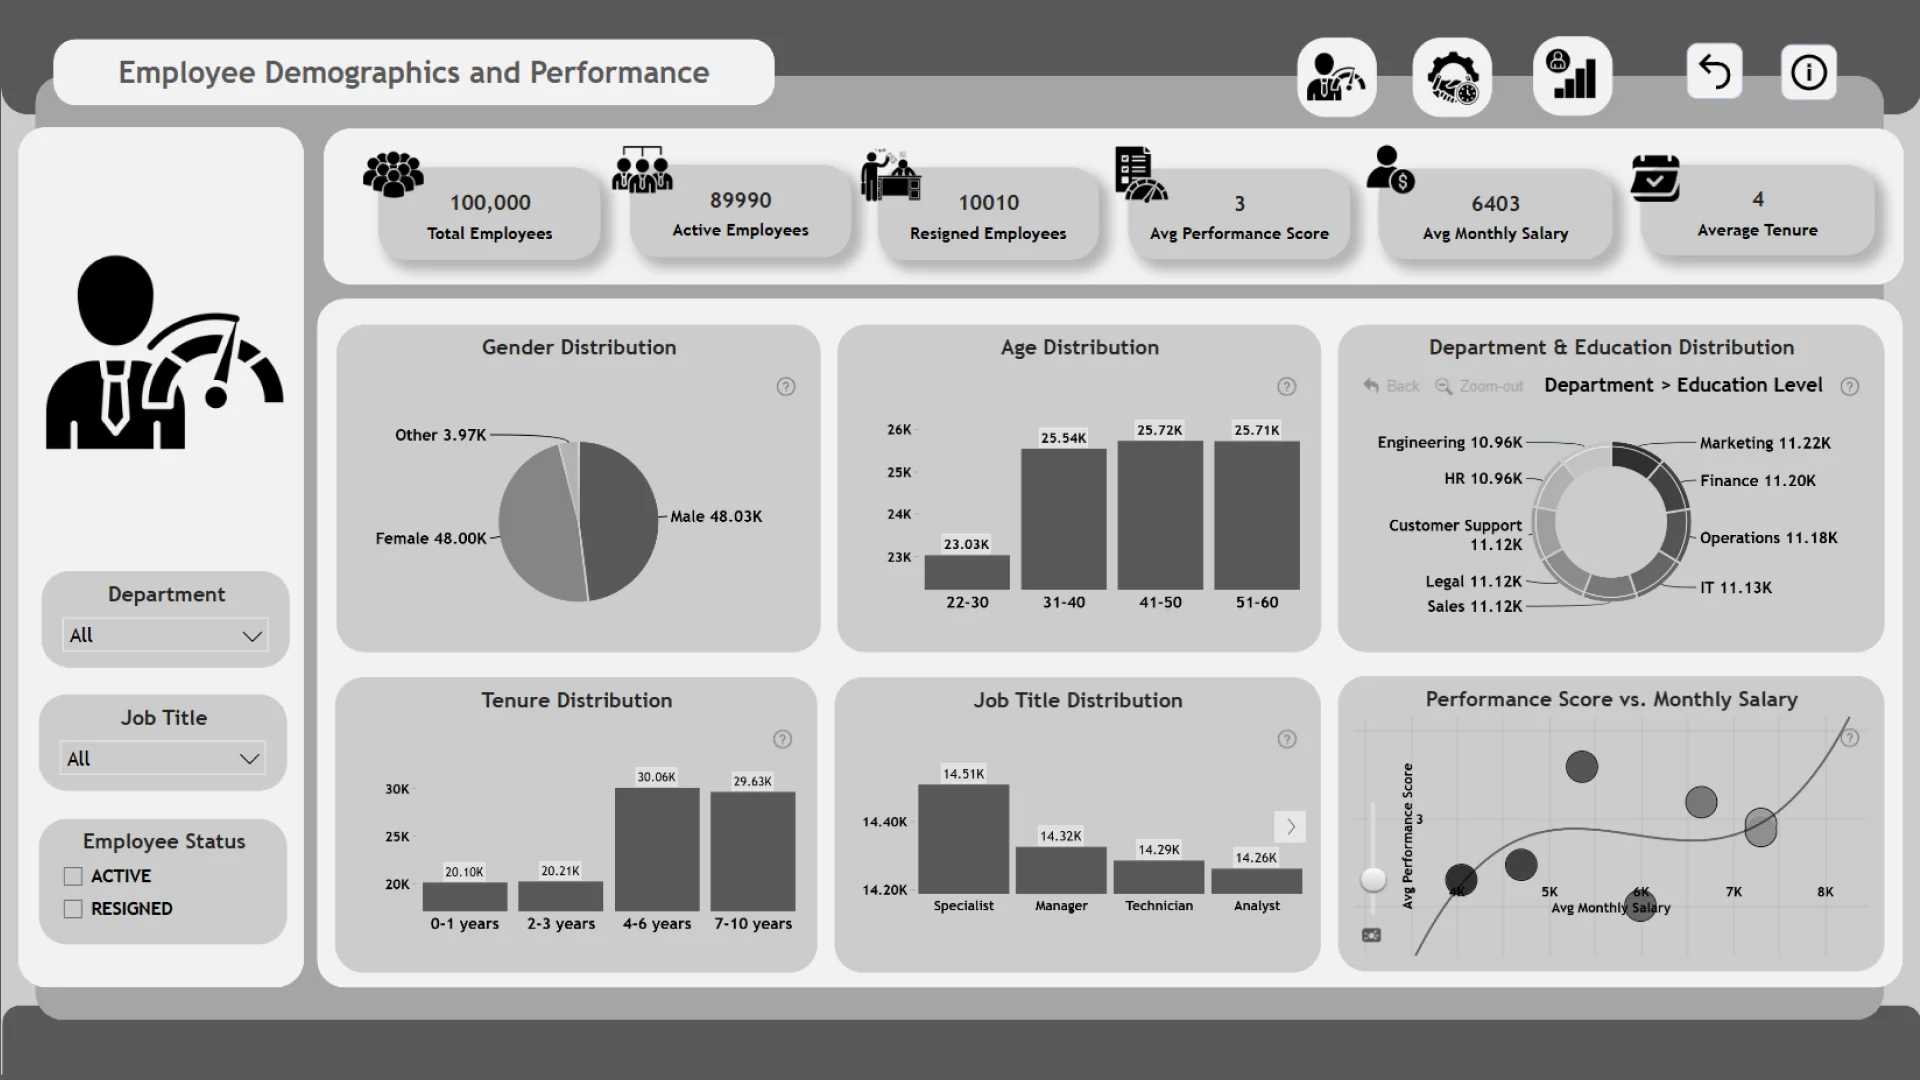
🔍 Demographics & Performance: A breakdown of the workforce by gender, age, and job title, along with how these factors relate to performance scores and salaries.
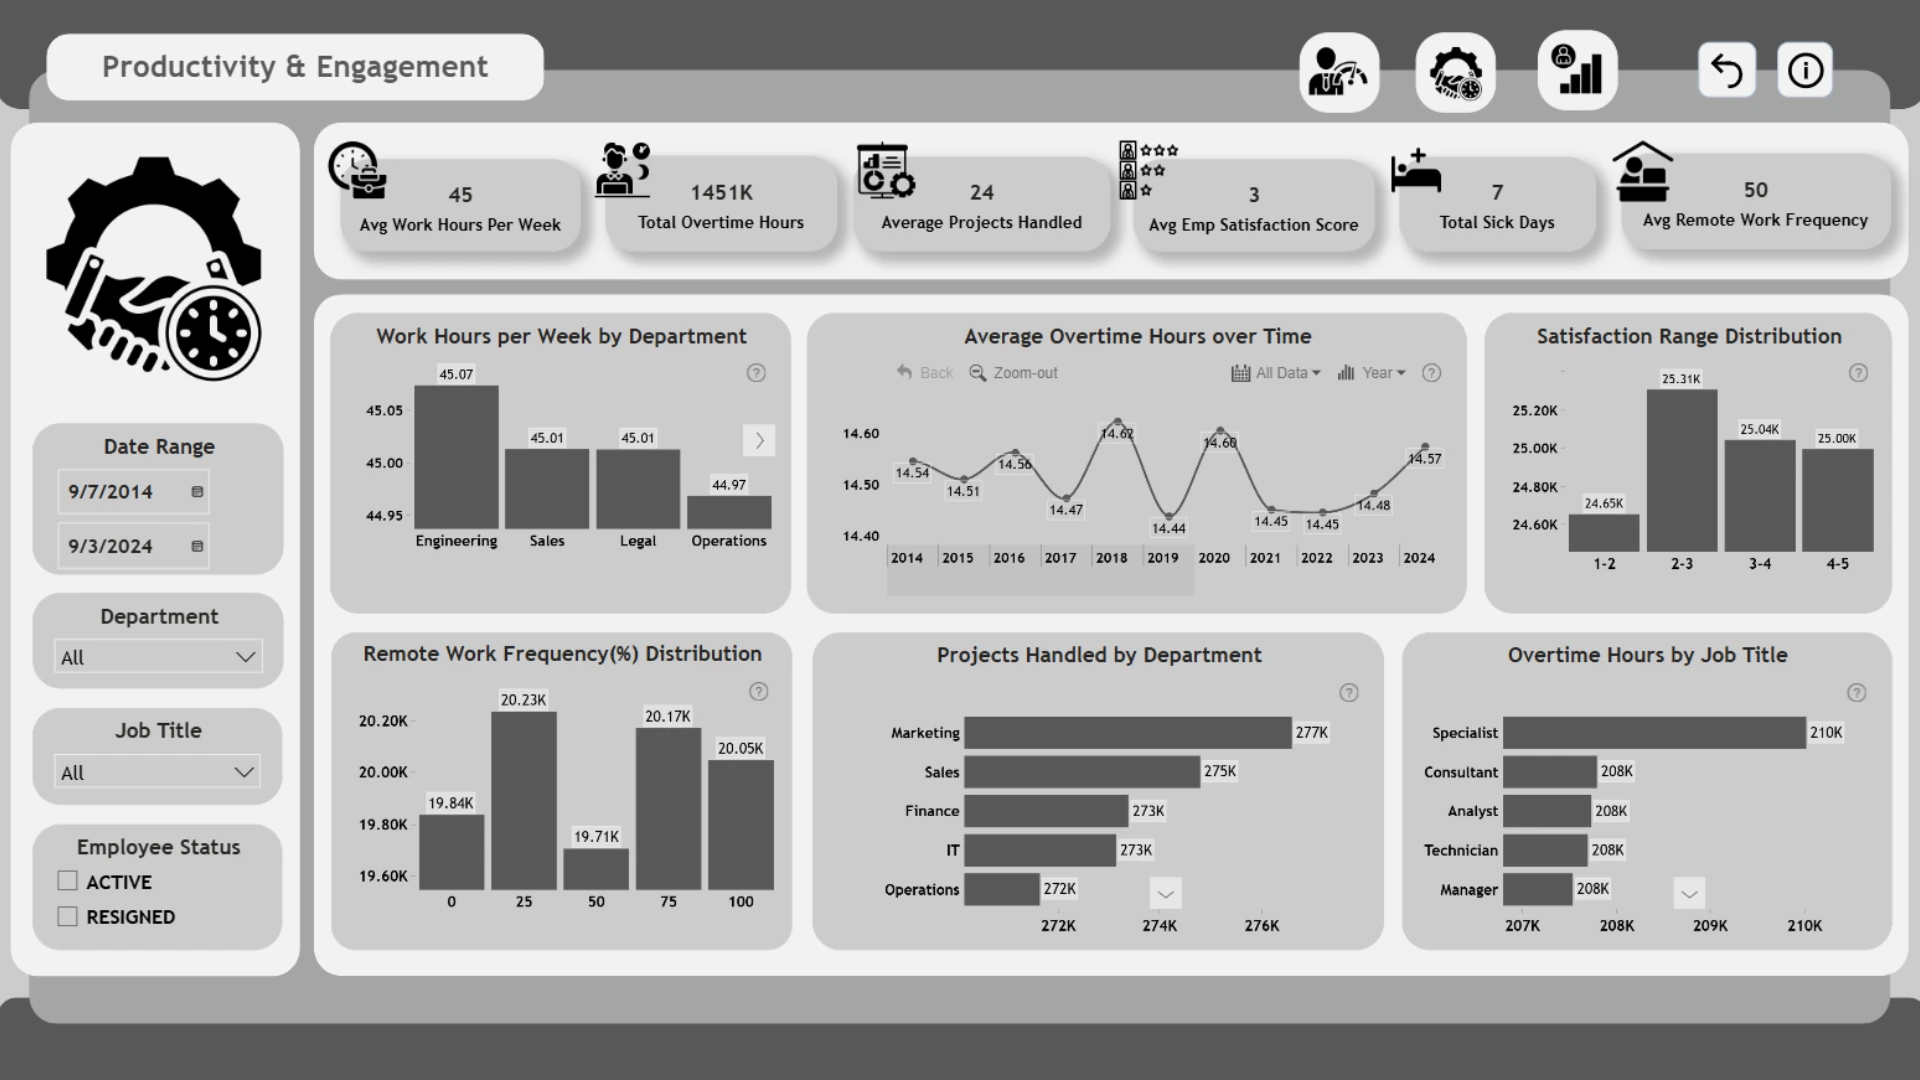
💼 Productivity Insights: Analyzing work hours, overtime trends, and project distribution across departments to reveal productivity drivers.
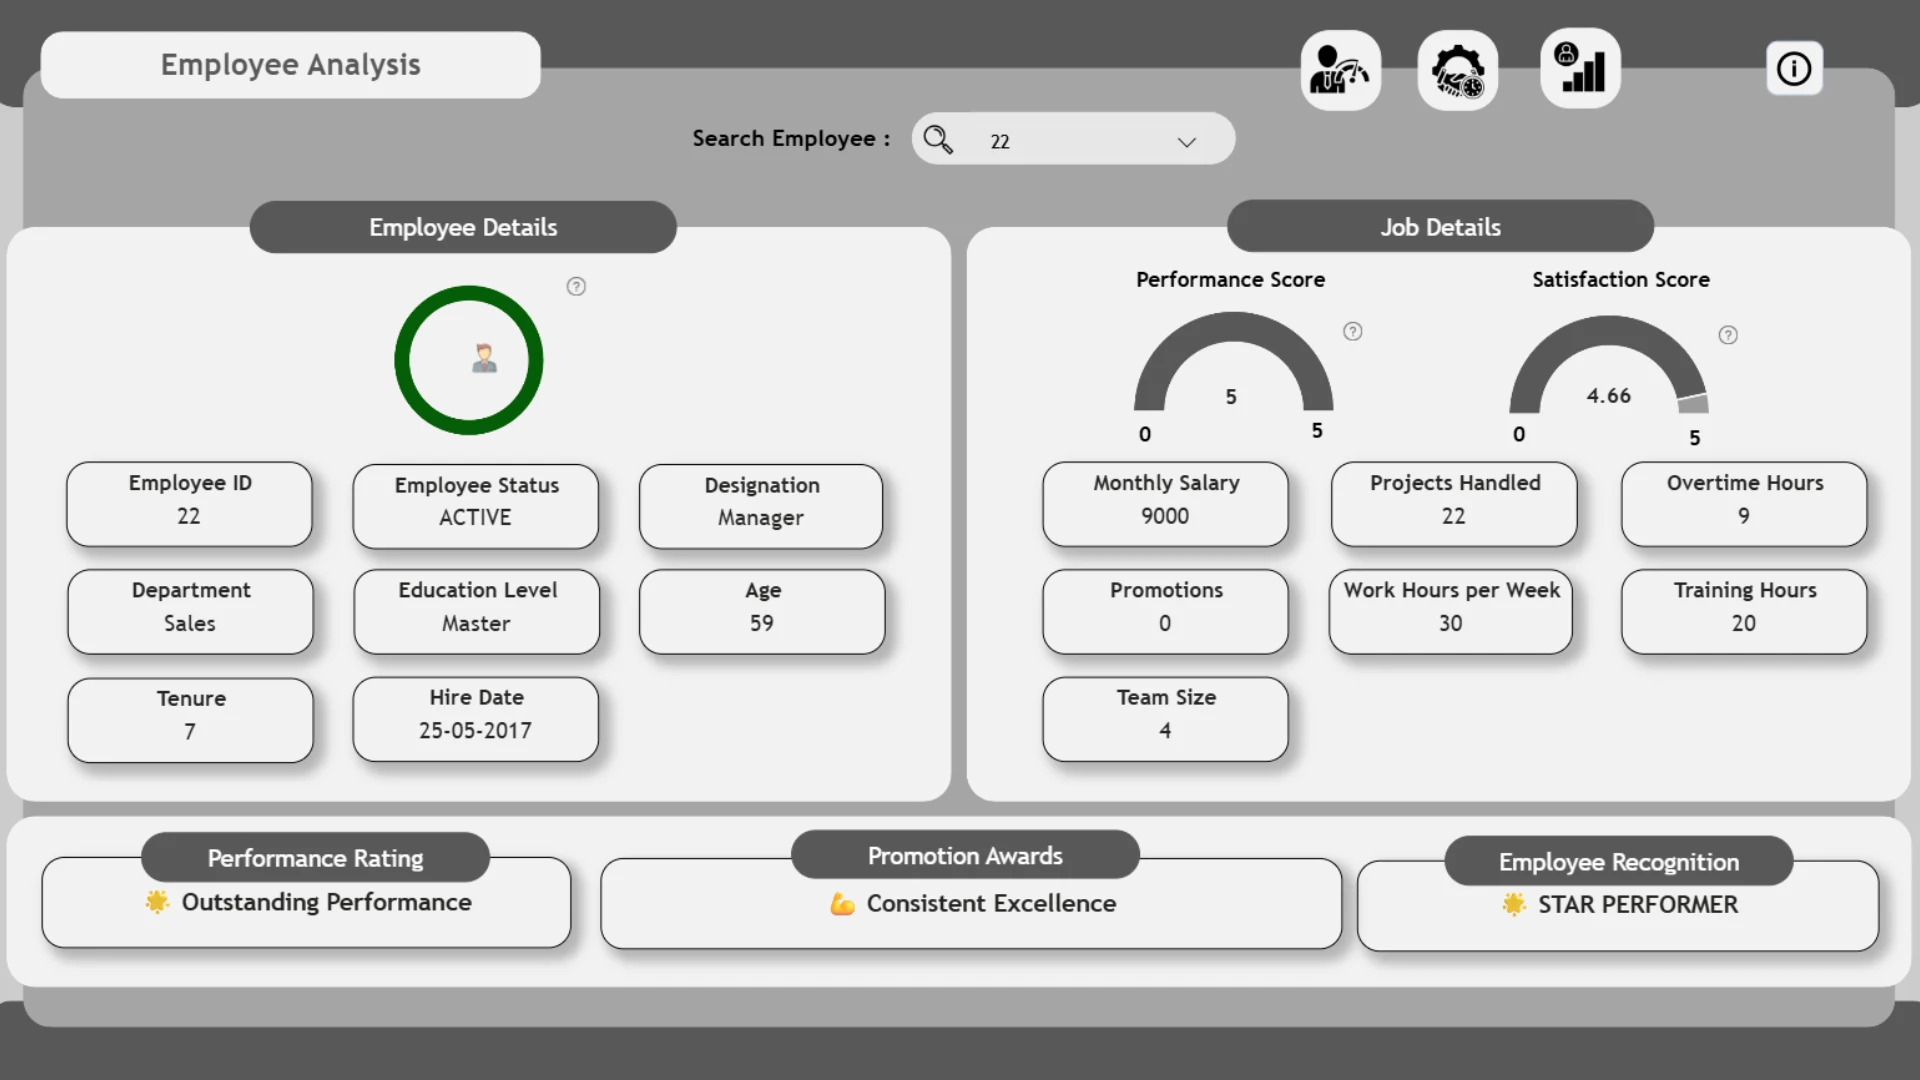
⭐ Employee Analysis: A deep dive into individual employee performance and recognition, highlighting top performers and areas where employees excel in productivity and satisfaction.
ZoomCharts visuals used
4U Report Challenges
Participate in data challenges, build and submit reports to get free template downloads.
Join CommunityMobile view allows you to interact with the report. To Download the template please switch to desktop view.
Was this helpful? Thank you for your feedback!
Sorry about that.
How can we improve it?