3167
Employee Performance Analysis
Employee Performance Analysis
Report Author: Ugochukwu Nwasuruba
3167
Share template with others
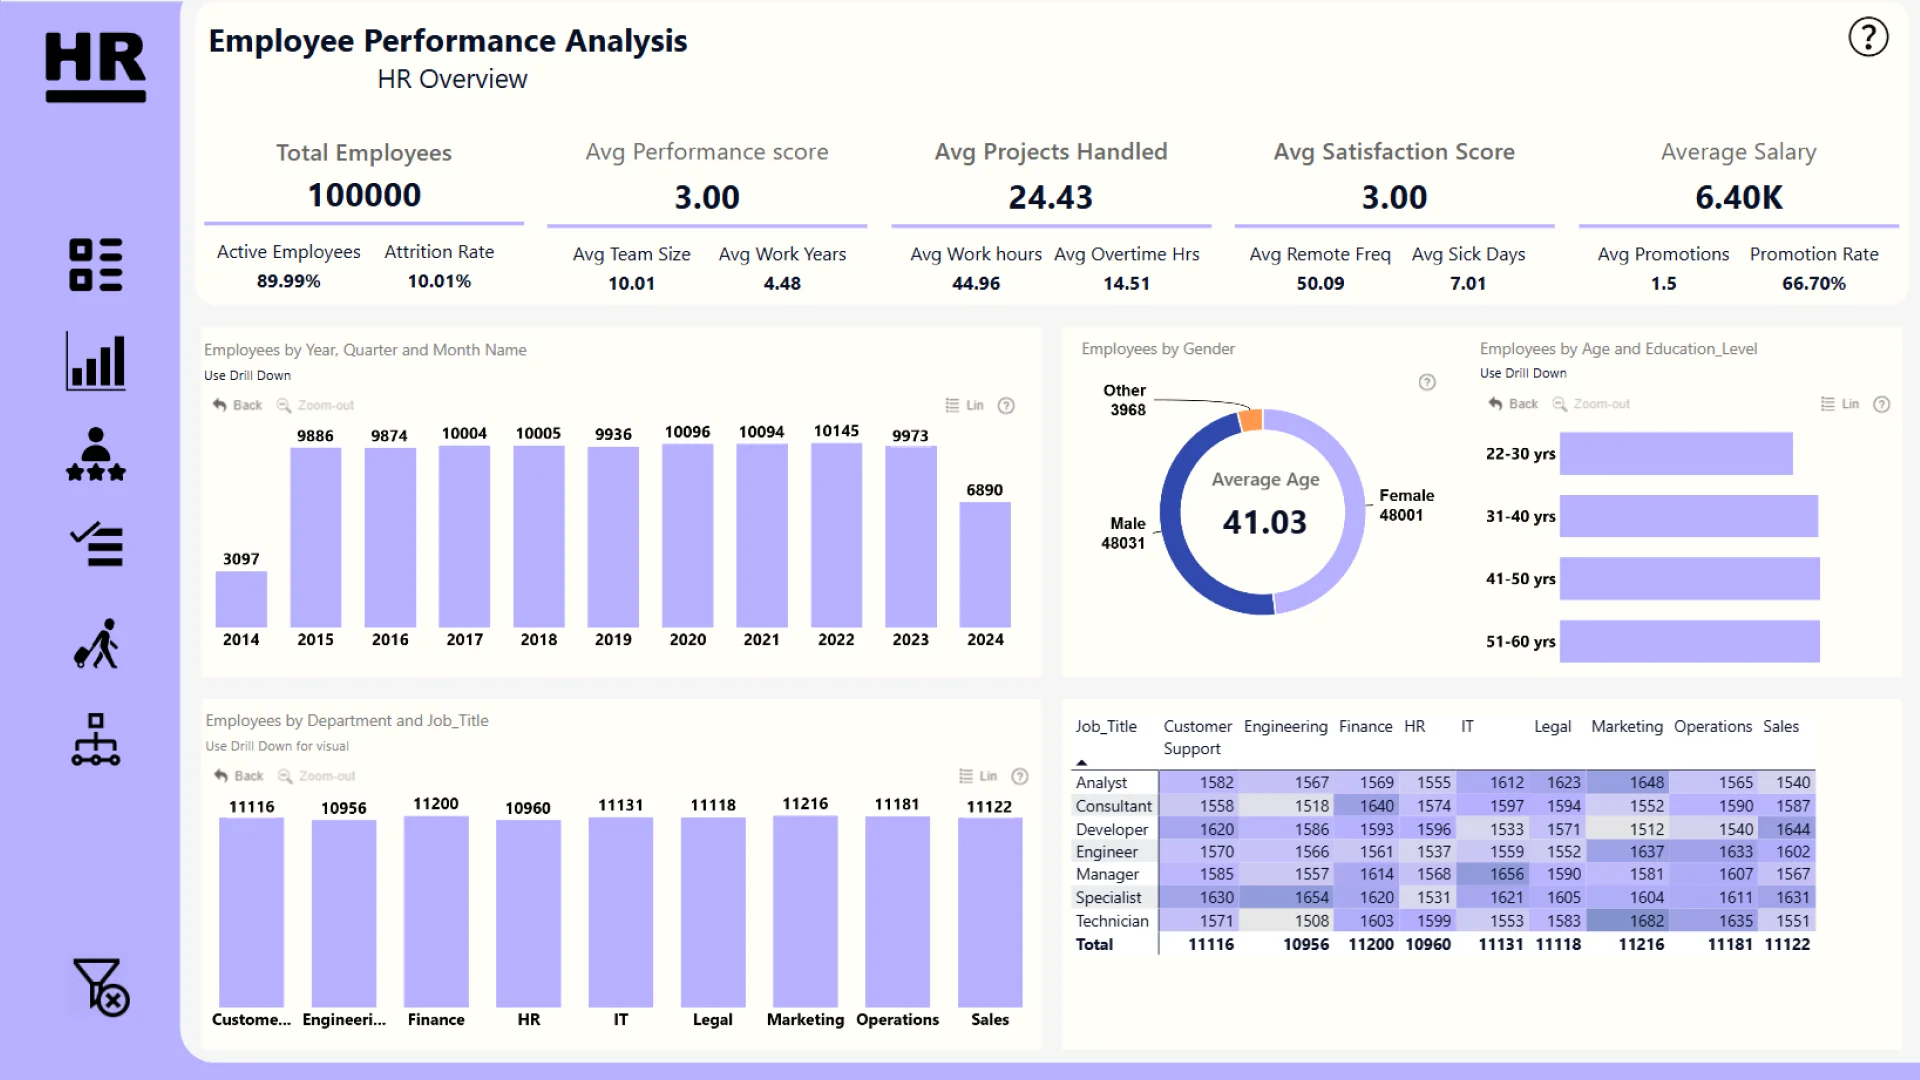
Report submitted for Onyx Data DataDNA ZoomCharts Mini Challenge, October 2024. The report was built based on Employee Performance dataset and includes ZoomCharts custom Drill Down PRO visuals for Power BI.
Author's description:
This comprehensive HR analytics dashboard provides a deep dive into workforce metrics across 100,000 employees. The report is structured into five key sections: HR Overview Top-level KPIs including total workforce (100,000), active employees (89.99%), and attrition rate (10.01%) Key averages for satisfaction (3.00), performance (3.00), and salary (6.40K) Performance Evaluation Detailed performance breakdowns by department, job title, and demographics Performance tracking across different roles with drill-down capabilities Promotion rate analysis (66.70%) Productivity Metrics Work patterns analysis (avg 44.96 hours) Project handling metrics (avg 24.43 projects) Team size and remote work frequency insights Job Satisfaction Employee satisfaction trends across departments Salary distribution and sick leave patterns Work-life balance indicators (14.51 overtime hours) Churn Analysis Detailed attrition patterns by demographics Risk analysis by department and role Tenure impact on retention (avg 4.48 years)
4U Report Challenges
Participate in data challenges, build and submit reports to get free template downloads.
Join CommunityMobile view allows you to interact with the report. To Download the template please switch to desktop view.

Was this helpful? Thank you for your feedback!
Sorry about that.
How can we improve it?