836
Email Marketing Campaign Analysis
Email Marketing Campaign Analysis
Report Author: Khadija Sarfraz
836
Share template with others
Report submitted for the FP20 Analytics ZoomCharts Challenge, October 2024. The report was built using the Marketing Email Campaign performance dataset and includes ZoomCharts custom Drill Down PRO visuals for Power BI.
Author's description:
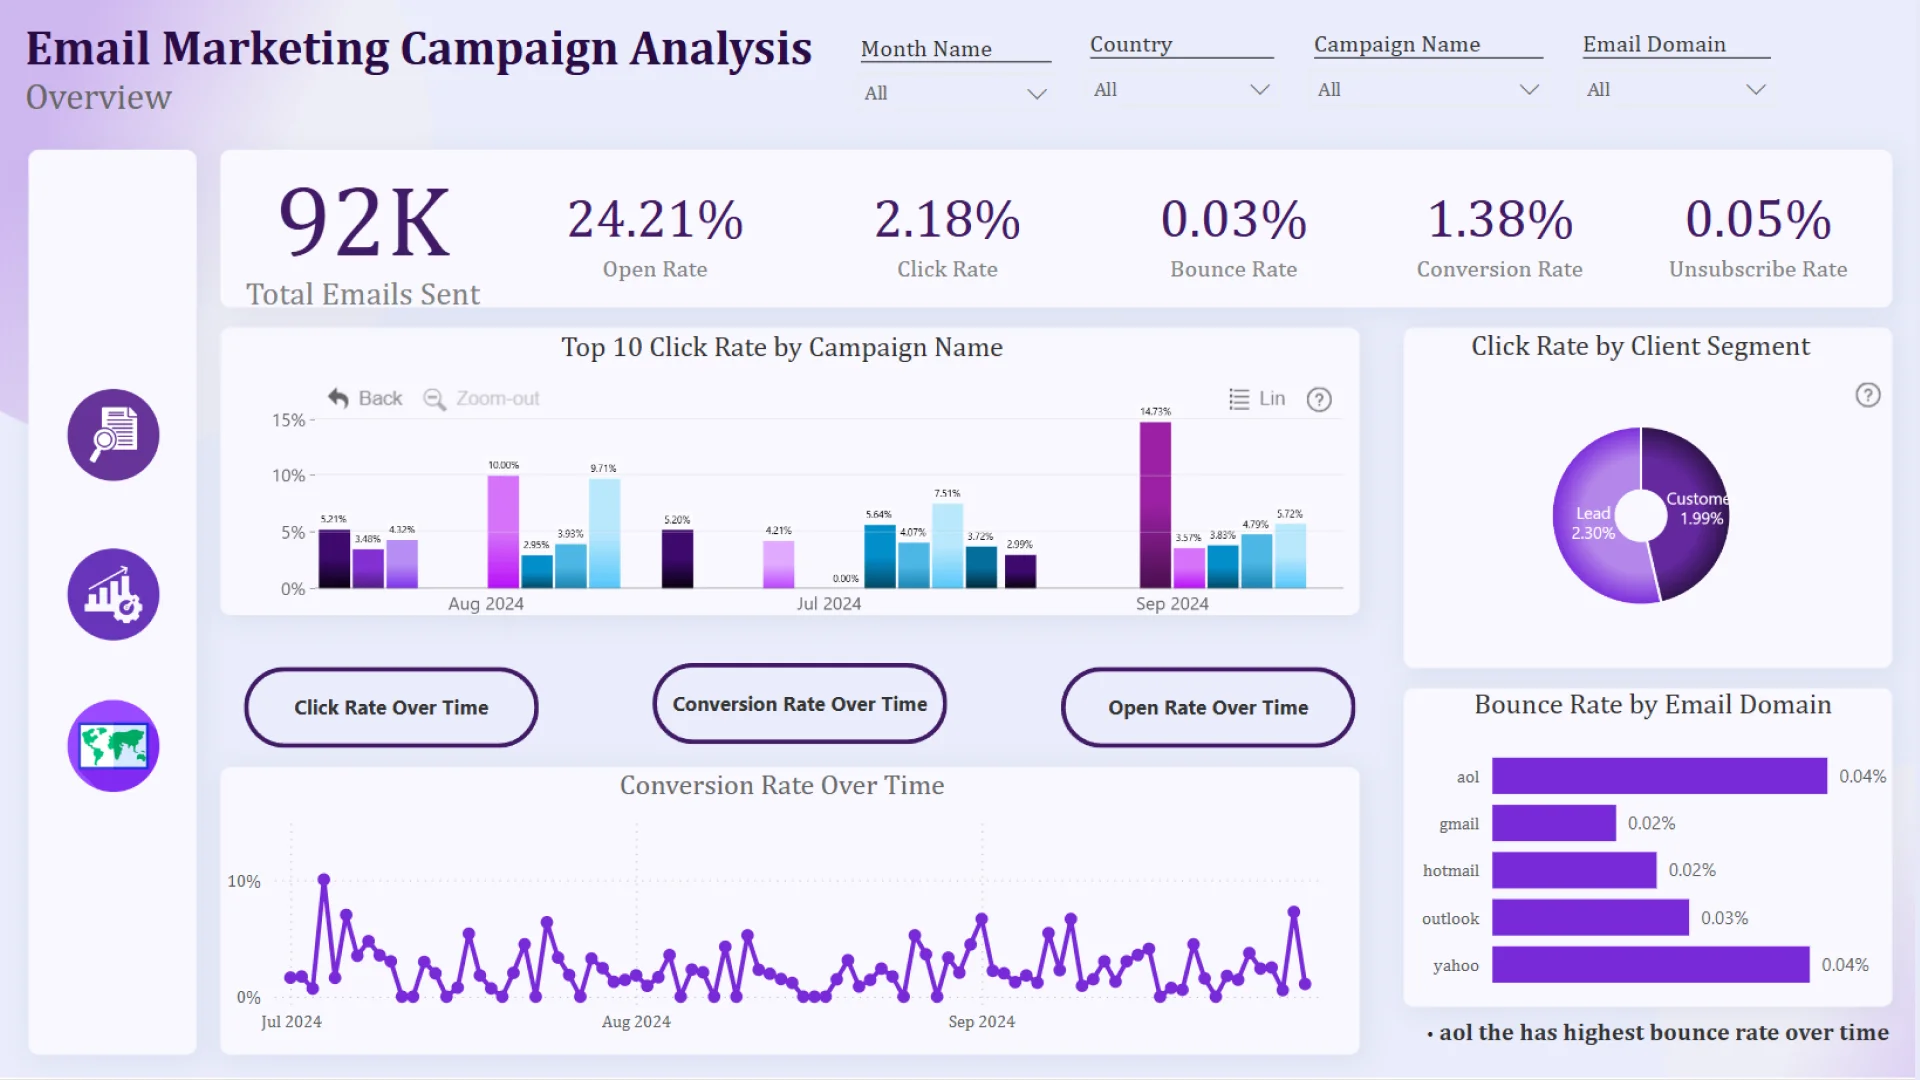
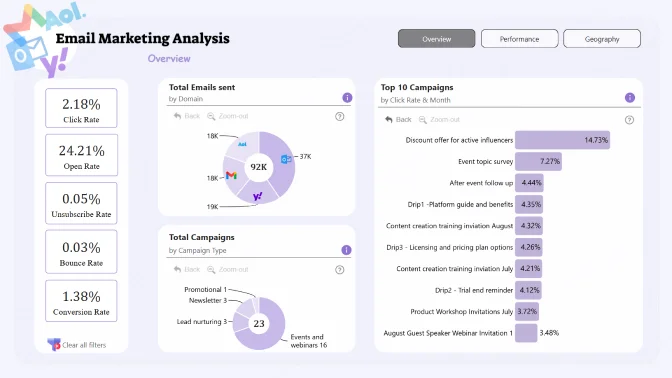
Thrilled to share my latest project: an in-depth Email Marketing Campaign Analysis using Power BI! Analyzing over 92k emails, I uncovered valuable insights into campaign performance, geographic engagement, and audience behavior. Here’s a look at the key findings:
🔹 Overview Page: A high-level view showcasing Open Rate, Click Rate, and Conversion Rate. Dynamic filtering and KPIs make it easy to monitor success over time.
🔹 Performance Analysis: A detailed breakdown of performance across devices, campaign types, and engagement patterns. This analysis highlights the most effective strategies for optimal reach and impact.
🔹 Geographic Analysis: A global view of campaign engagement, revealing high-conversion regions and insights into country-specific performance.
Top Insights:
📈 Iceland achieved the highest conversion rate for July campaigns.
📉 Afghanistan recorded the lowest click rate in September campaigns.
💡 Desktop users showed the strongest engagement, with open and click rates peaking mid-week.
4U Report Challenges
Participate in data challenges, build and submit reports to get free template downloads.
Join CommunityMobile view allows you to interact with the report. To Download the template please switch to desktop view.
Was this helpful? Thank you for your feedback!
Sorry about that.
How can we improve it?