646
Electronic Reviews and Rating Report
Electronic Reviews and Rating Report
Report Author: Laiba Binte Mazhar
646
Share template with others
Report submitted for Onyx Data DataDNA ZoomCharts Mini Challenge, February 2024. The report was built based on Electronics Product Data Ratings dataset and includes ZoomCharts custom Drill Down PRO visuals for Power BI.
Author's description:
A comprehensive analysis of your electronic reviews and ratings dataset using various visualizations in Power BI.
Here's a brief summary of the insights gained:
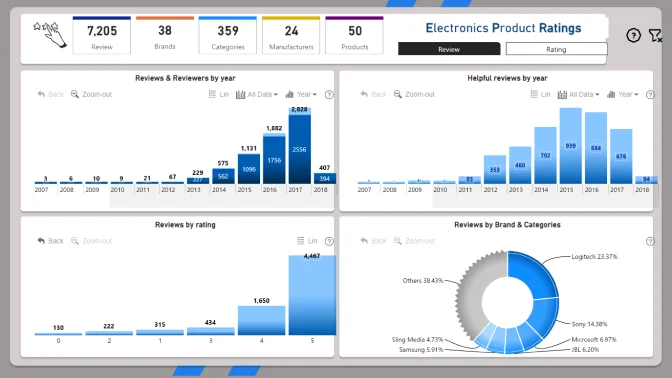
- Identified the most highly rated brands, the trend of helpful reviews over time,
- Visualize customer recommendations from reviews,
- Compare the average number of helpful reviews across different products,
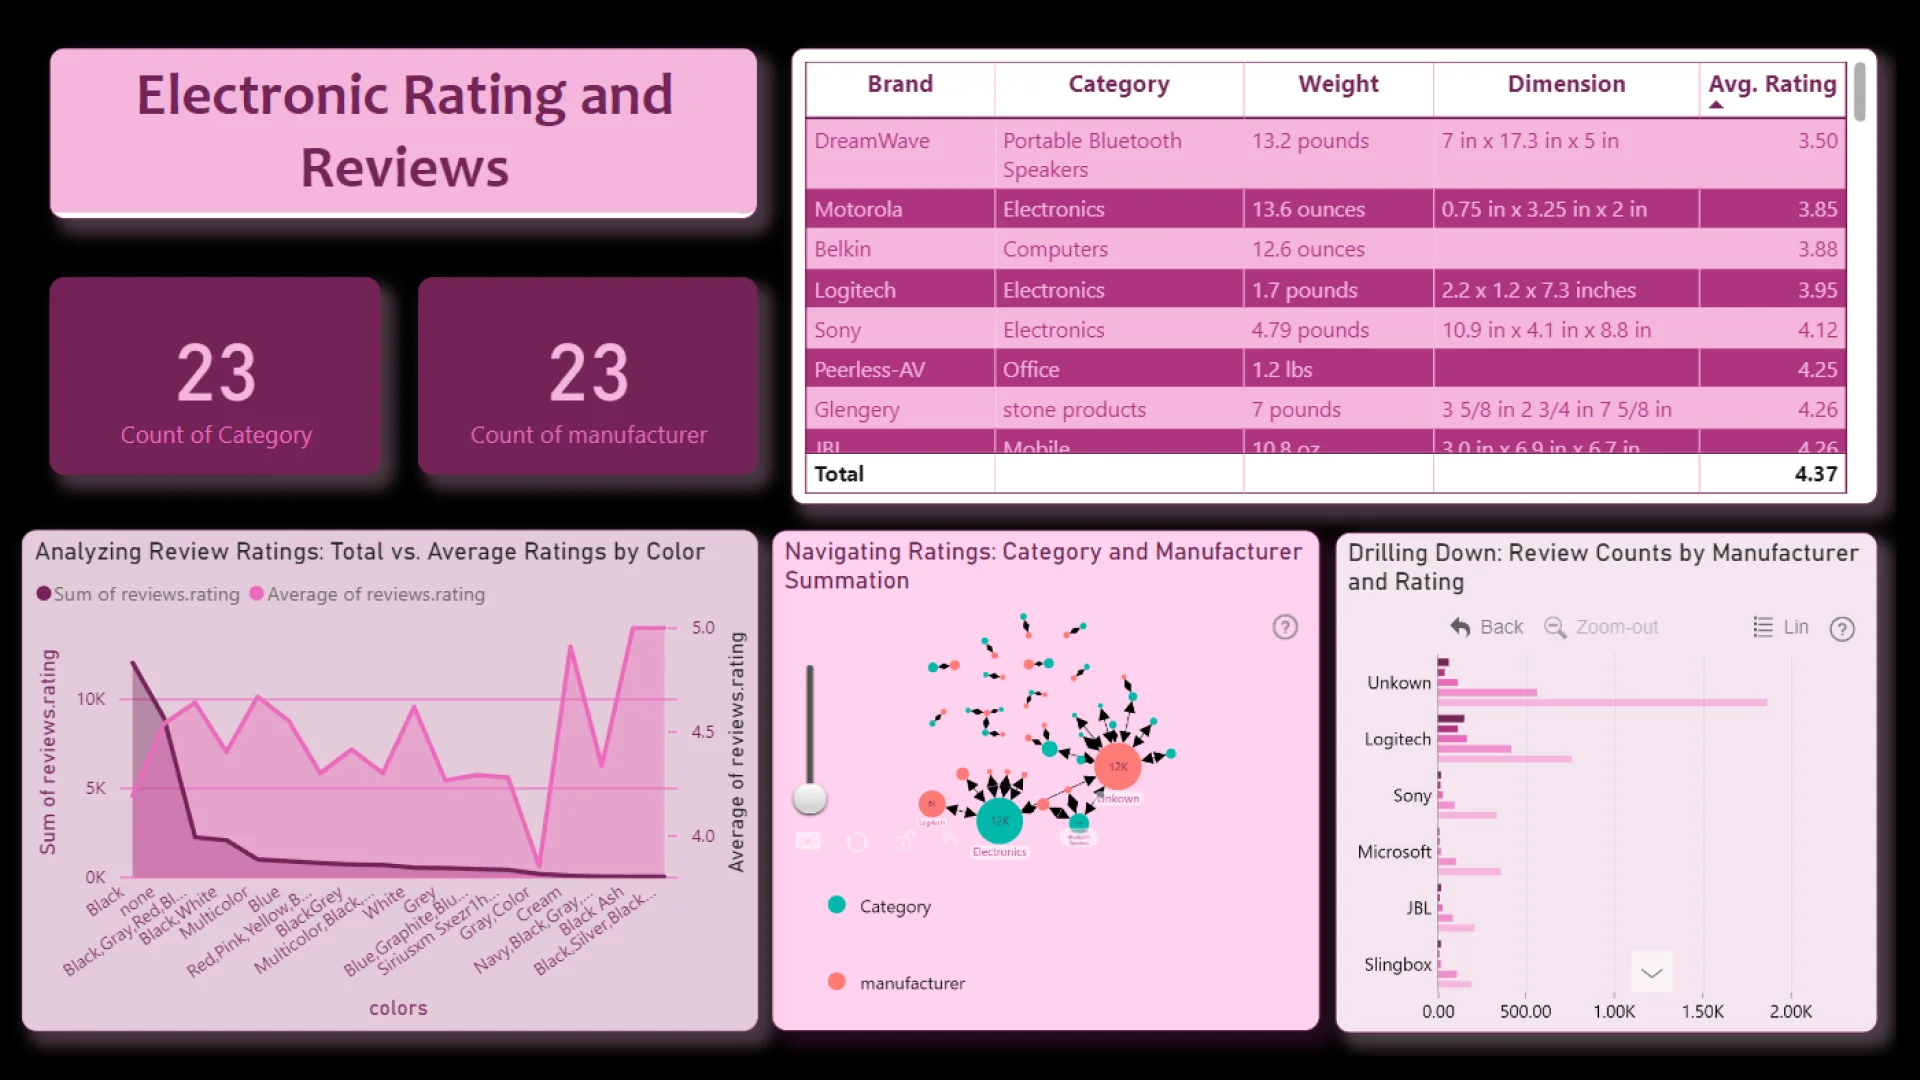
- Analyzes review ratings by comparing total vs. average ratings by color,
- Shows the summation of categories and manufacturers etc.,
ZoomCharts visuals used
4U Report Challenges
Participate in data challenges, build and submit reports to get free template downloads.
Join CommunityMobile view allows you to interact with the report. To Download the template please switch to desktop view.
Was this helpful? Thank you for your feedback!
Sorry about that.
How can we improve it?