29129
Customer Review Analysis Power BI Report by Prathamesh Sawant
Customer Review Analysis Power BI Report by Prathamesh Sawant
More Report pages
Report Author: Prathamesh Sawant
29129
Share template with others
Summary
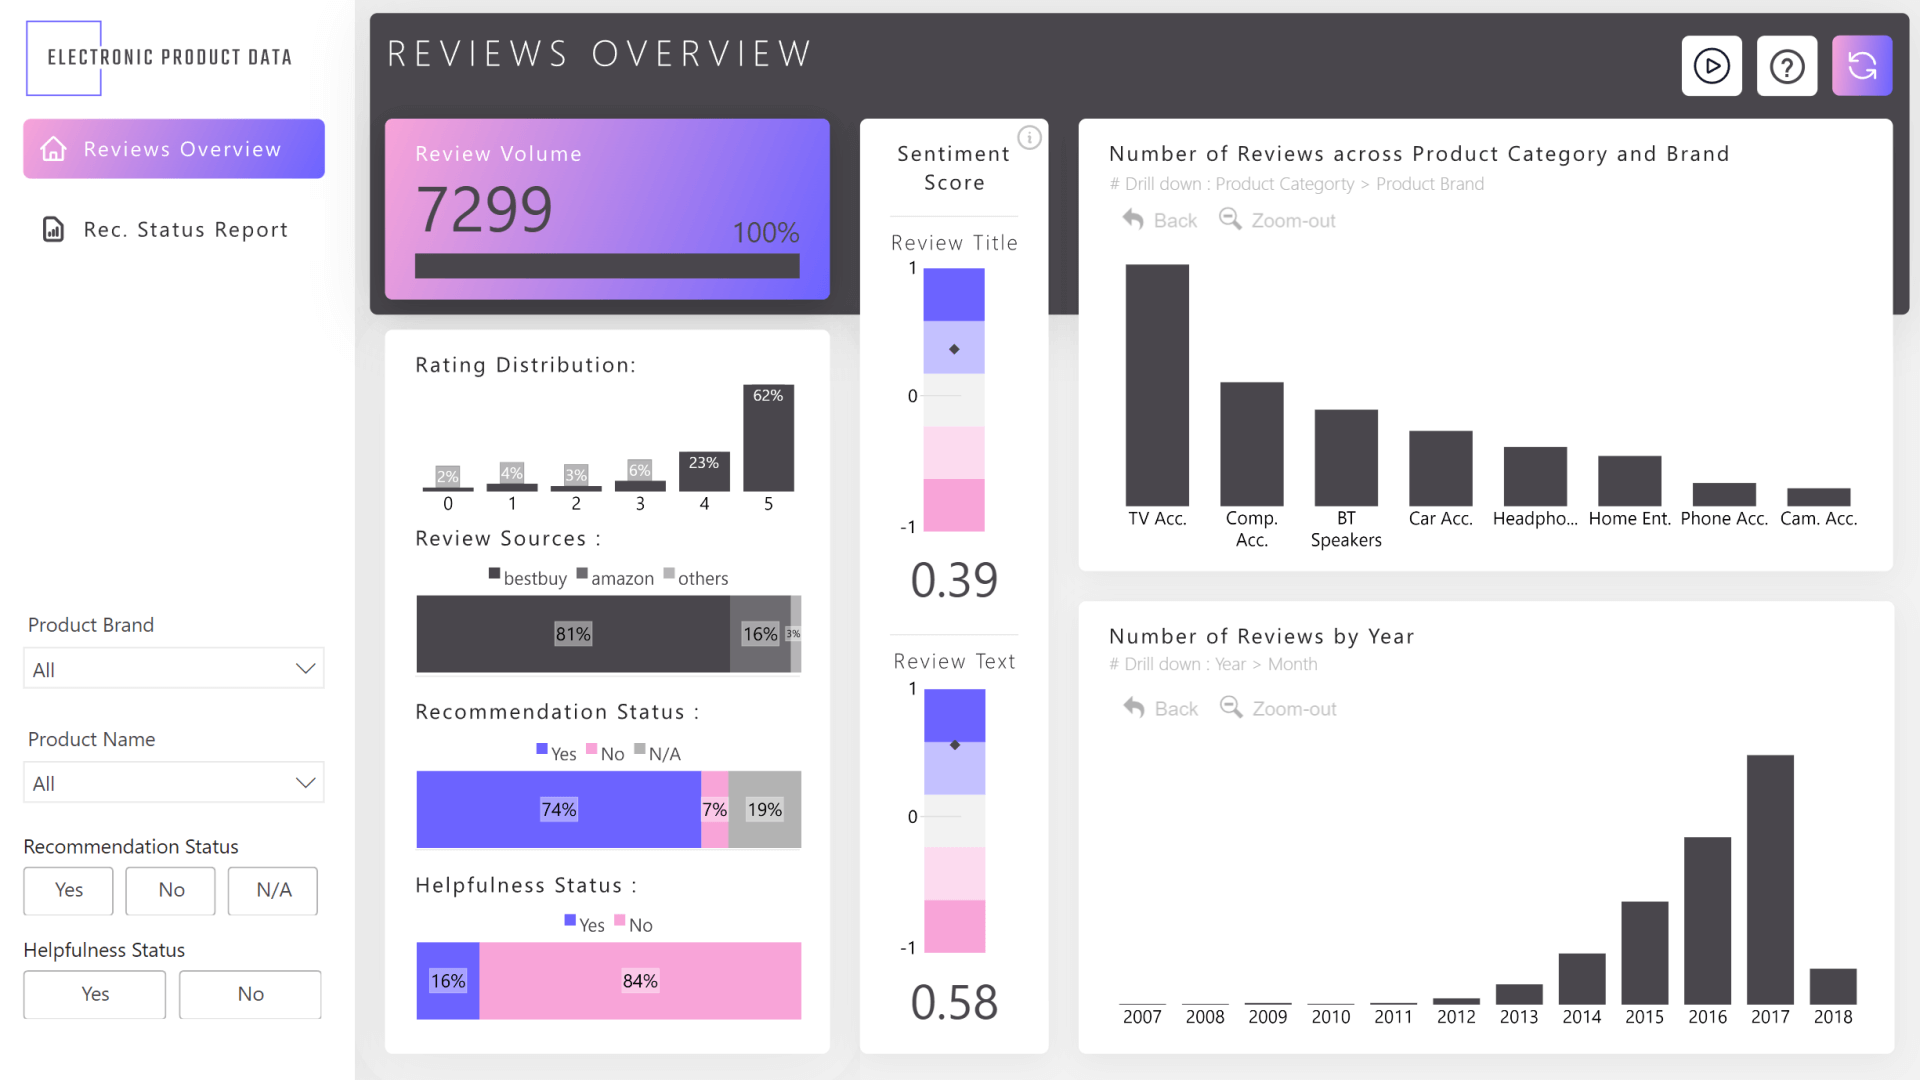
This Power BI report is based on the winning entry for ZoomCharts Mini Challenge which was hosted as a part of the Onyx Data February 2024 Challenge. This report uses a customer review dataset from an electronic product retailer, and its aim is to visualize insights about customer sentiment and identify trends.
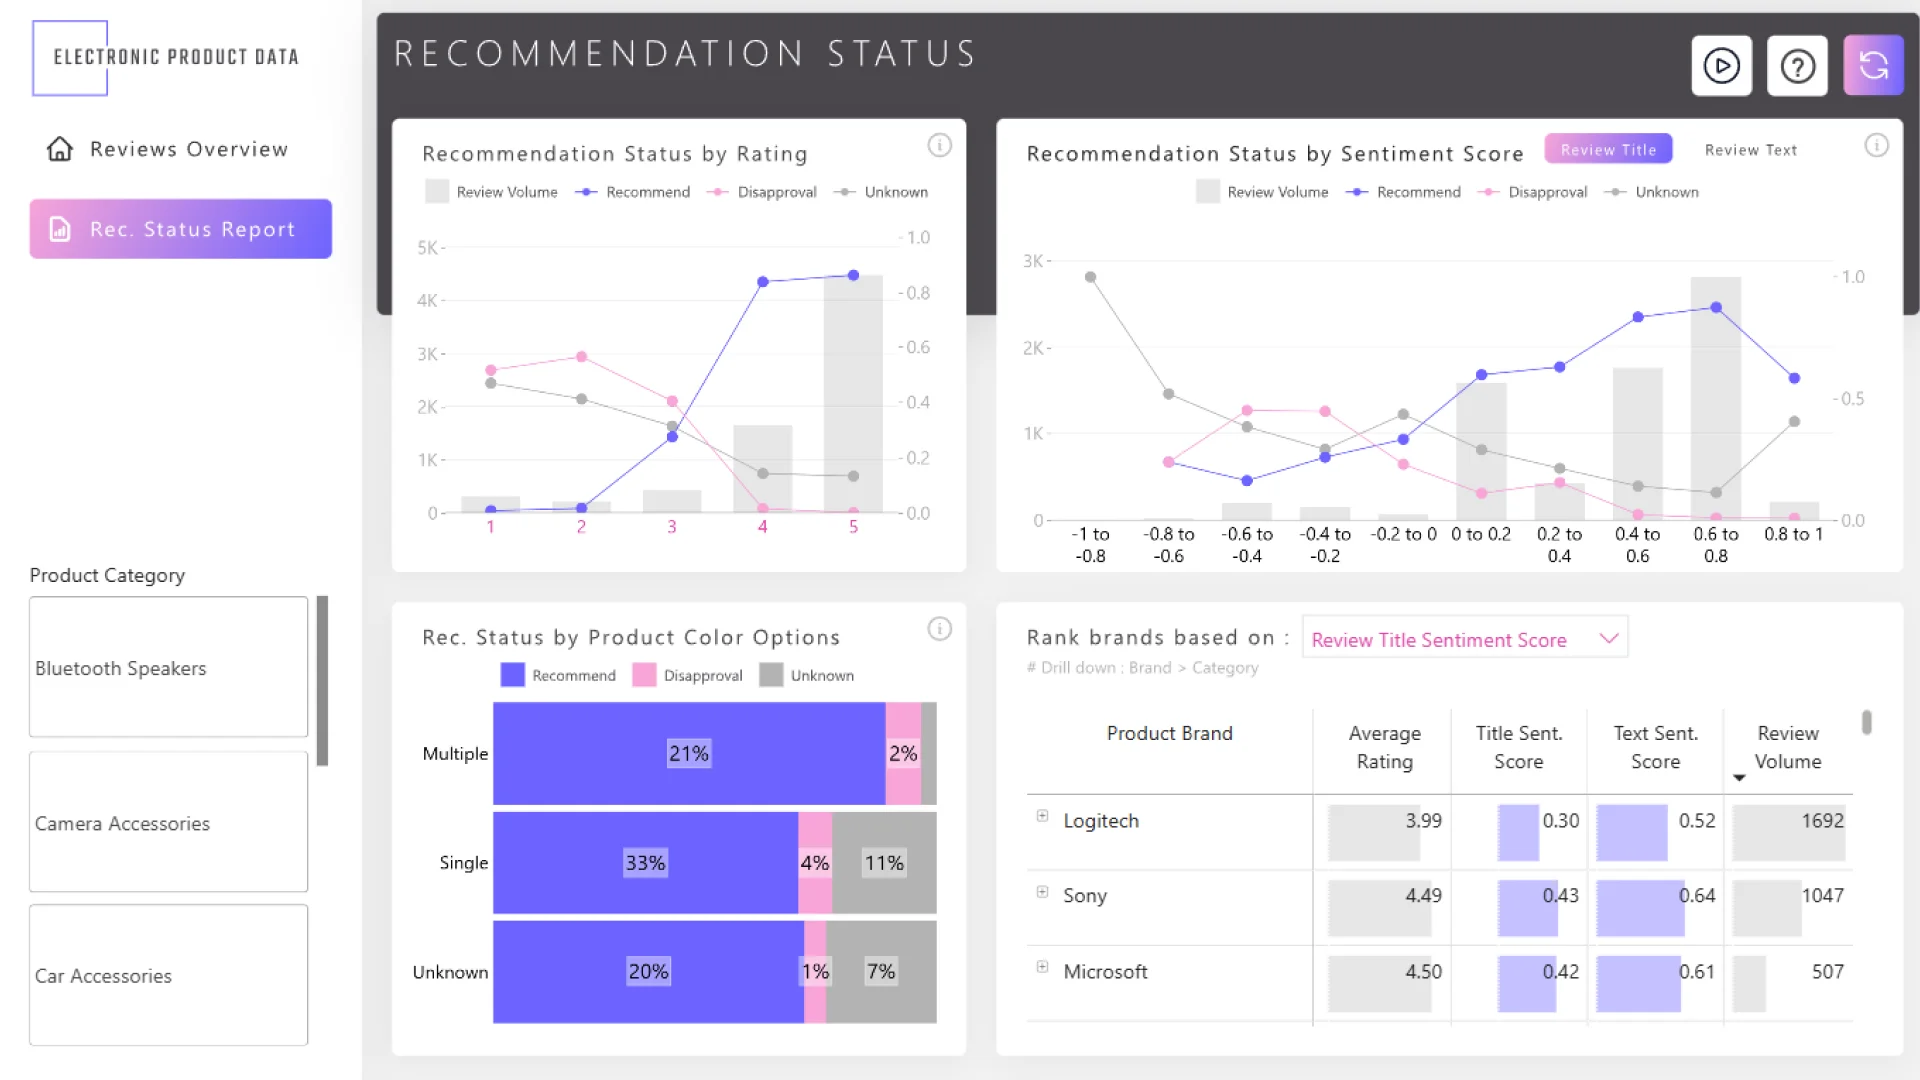
The report visualizes the number of reviews (total, per year/month and per each product category/brand), rating distribution, recommendation percentage, and the average review sentiment. You can also use slicer menus to filter by specific brands or products.
The report is based on the challenge submission with minor refinements by the ZoomCharts team. See the original submission here.
How To Use This Report Template
To interact with this Power BI report, simply click any active elements directly on the charts.
Download this report to see all the settings, formulas, and calculations. Try it out with your own data by making a few adjustments.
4U Report Challenges
Participate in data challenges, build and submit reports to get free template downloads.
Join CommunityMobile view allows you to interact with the report. To Download the template please switch to desktop view.
Was this helpful? Thank you for your feedback!
Sorry about that.
How can we improve it?