Feel free to leave your vote:
34
Share template with others
Summary
Report submitted for Onyx Data DataDNA ZoomCharts Mini Challenge, February 2024. The report was built based on Electronics Product Data Ratings dataset and includes ZoomCharts custom Drill Down PRO visuals for Power BI.
Author's description:
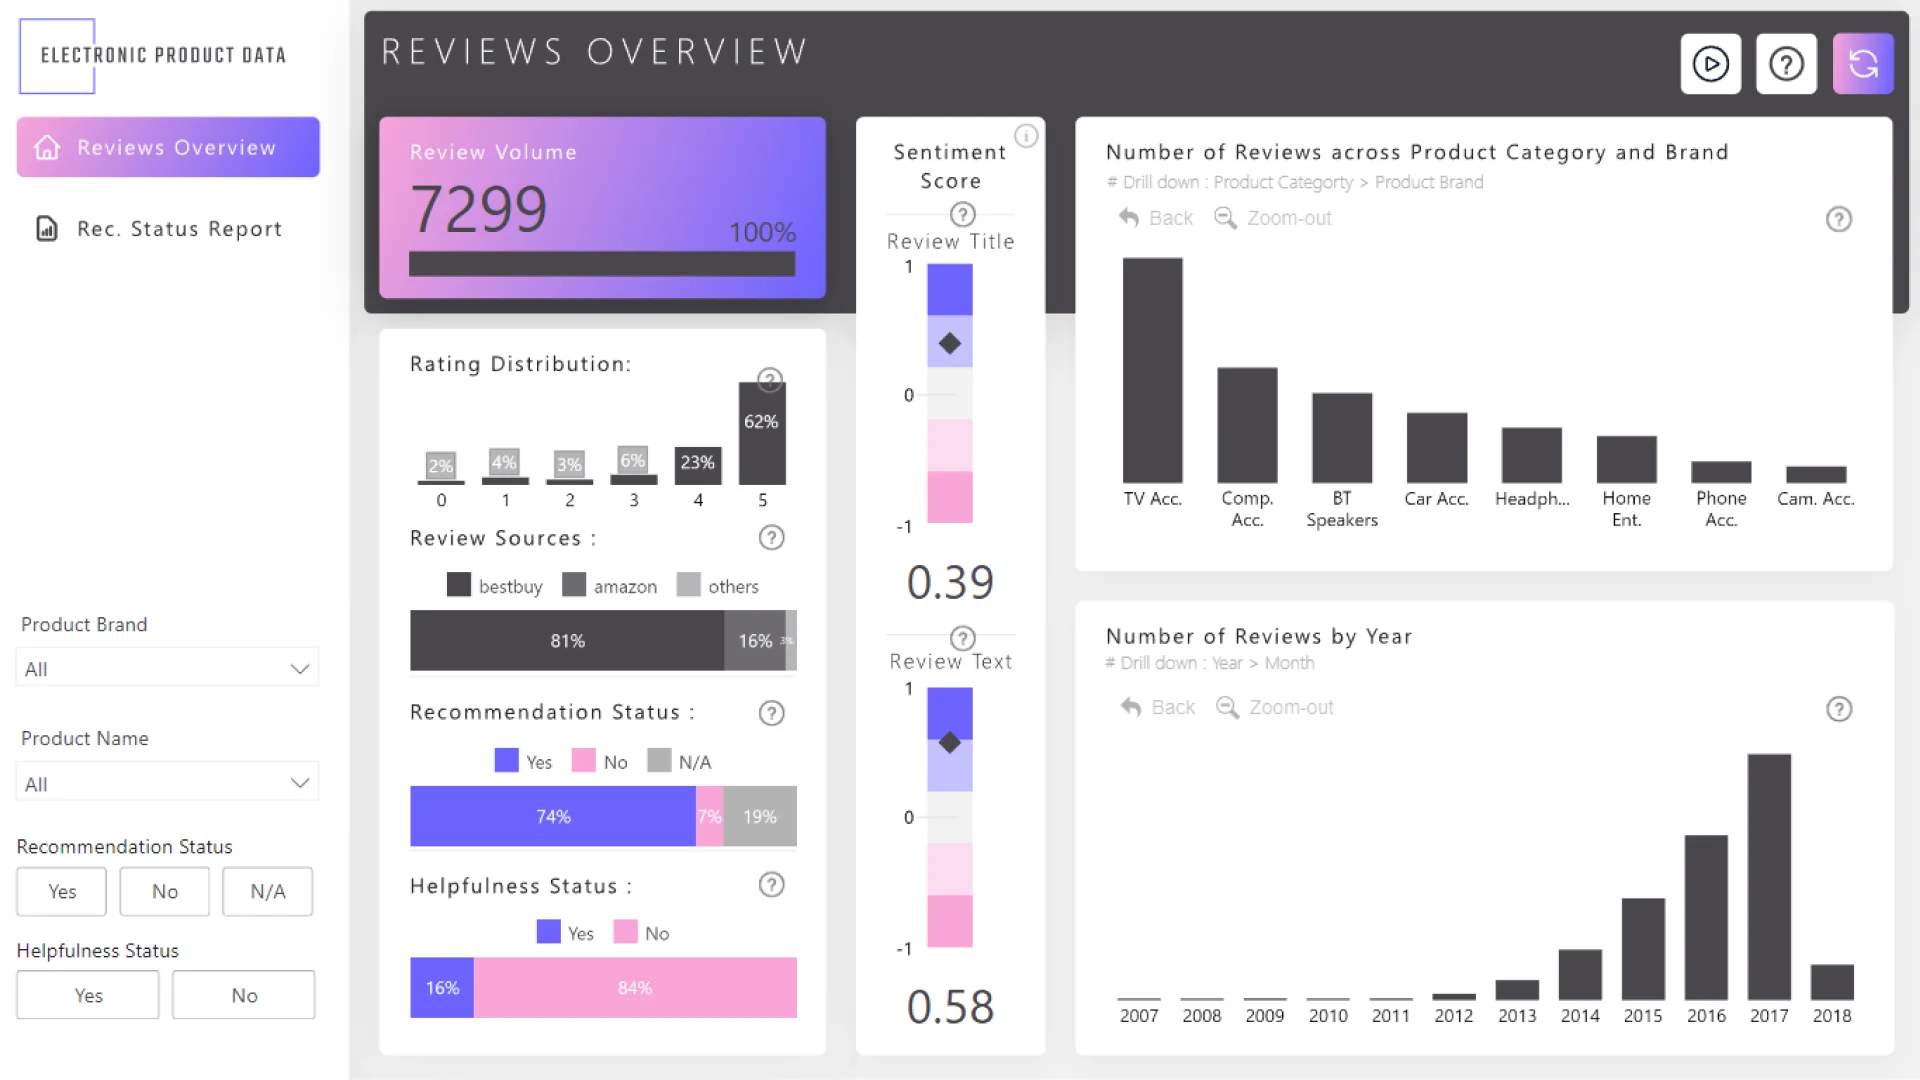
The submission for the Challenge is a comprehensive Power BI dashboard designed to provide deep insights into product reviews and recommendation status. The dashboard comprises two pages: "Review Overview" and "Recommendation Status."
Review Overview Page: This page offers an overview of the reviews dataset, enabling users to understand the distribution of reviews, sentiment analysis, and key metrics. It includes: A card displaying the total number of reviews (Review Volume) and the percentage of reviews. Stack bar visuals illustrating the source of reviews, their distribution across recommendation status, and helpfulness status. A column chart depicting the distribution of reviews across different ratings. A card showcasing the average rating across all reviews. Zoomcharts Drill Down Combo Pro visuals: Distribution of reviews across product categories and brands, allowing users to drill down for deeper insights. Distribution of reviews across years and months, enabling users to analyze trends over time. A gauge chart derived from the Zoomcharts Drill Down Combo Pro visual, presenting the sentiment score for review text and titles.
Recommendation Status Page: This page focuses on analyzing the relationship between recommendation status and various factors such as ratings, sentiment score, and product attributes. It includes: Zoomcharts Drill Down Combo Pro visuals: Analysis of recommendation status across different ratings, facilitating deeper exploration. Exploration of recommendation status across sentiment scores, providing insights into the correlation between sentiment and recommendations. Zoomcharts Drill Down Combo Bar Pro visual illustrating recommendation status across product color options. A matrix ranking product brands based on average rating, text sentiment score, title sentiment score, and review volume. Additional Features: Info overlay provides guidance on navigating the dashboard effectively. Clear All filter button enables users to reset filters with a single click. GIF demonstration button guides users on how to utilize Zoomcharts visualizations efficiently.
Mobile view allows you to interact with the report. To Download the template please switch to desktop view.